Electricity and Steam Flow in Canada shown in PJ 2022
Click to see detailed description
This diagram illustrates the sources and flows of energy used to generate electricity and steam in Canada. It depicts the contribution of various energy inputs—including hydro, nuclear, natural gas, coal, wind, biomass, refined petroleum products, solar, geothermal, and tidal energy—as well as electricity imports and exports. The diagram also shows the total electricity and steam available for domestic consumption and their distribution across economic sectors.
Hydro and nuclear power together account for approximately 75% of total electricity generation in Canada and represent major sources of clean, low‐emission energy. Among end‐use sectors, the industrial sector is the largest consumer, followed by the residential sector. Combined, these two sectors account for more than 71% of total electricity and steam consumption. The commercial and institutional sector consumes about 27%, while the agricultural sector accounts for roughly 2% of total use.
Input and output data may not balance because the input includes only RESD data and does not capture other external sources used as inputs; these are explained in Appendix A.
Electricity and Steam Flow
-
The electricity production is the sum of primary electricity and secondary electricity. The primary electricity is generated by hydro, nuclear wind, tidal and solar. The secondary electricity is generated from thermal generation such as burning oil, liquid natural gas, coal and other substances to rotate generators.
-
The input energy for electricity and steam generation is the sum of:
- hydro, nuclear, coal, natural gas, refined petroleum products (petroleum coke, heavy fuel oil, diesel fuel oil, light fuel oil, motor gasoline), wind, biomass, solar, tidal, geothermal, wood and other fuel types for electricity generation plus input energy used for steam generation.
- The input values for wind, nuclear, hydro, solar, and geothermal fuel types indicate the generated electricity (PJ) by these energy sources.
- RESD table, Electricity generation table in the Energy Use Data Handbook by NRCan.
- 25-10-0020-01: Electric power, annual generation by class of producer Canada, Province or territory, annual
- Data sources:
-
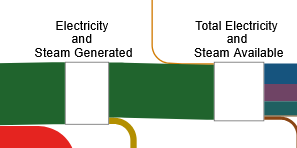
Electricity and steam production and available electricity and steam
Steam production and availability are added to the electricity flow line.
-
Total electricity and steam consumption is the sum of all sectors.