
Natural Resources Canada
www.nrcan.gc.ca
Common menu bar links
Office of Energy Efficiency Links
Personal: Residential
Menu
Improving Energy Performance in Canada – Report to Parliament Under the Energy Efficiency Act For the Fiscal Year 2005-2006
PDF VersionNext Page
Table of Contents
Chapter 1: Trends in Energy Use
Introduction
Canadians enjoy an abundance of energy from a variety of sources. This comparative advantage in the supply of energy helps Canadians deal with the economic disadvantages of small domestic markets, long distances, rugged geography and a relatively harsh climate. It has also fostered the development of industries that have a particularly strong energy demand.
Canadians spent almost $135 billion in 2004 on energy to heat and cool their homes and offices and to operate their appliances, cars and industrial processes. This represents 12.9 percent of the country's gross domestic product (GDP).
Energy Use and Greenhouse Gas Emissions
There are two general types of energy use: primary and secondary. Primary energy use encompasses the total requirements for all users of energy, the energy required to transform one energy form to another (e.g. coal to electricity) and the energy used to bring energy supplies to the consumer. Secondary energy use is energy used by final consumers for residential, commercial/institutional, industrial, transportation and agricultural purposes.
Primary energy use in Canada today reflects changes over several decades in energy-consuming equipment and buildings and in the behaviour of energy users. Primary energy use increased by 27.9 percent between 1990 and 2004, from 9743 petajoules to 12 463 petajoules.
Secondary energy use (8543 petajoules) accounted for 68.5 percent of primary energy use in 2004. It was responsible for 66.6 percent (505 megatonnes) of total greenhouse gas (GHG) emissions in Canada, if indirect emissions – namely, those produced by electric utilities to meet end-use electrical demand – are included.
This report deals with energy-related GHG emissions, which comprise carbon dioxide (CO2), methane and nitrous oxide. CO2 accounts for most of Canada's GHG emissions. All subsequent references in this report to CO2 and GHGs include emissions that are attributable directly to secondary energy use and indirect emissions attributable to electricity generation, unless otherwise specified.
From 1990 to 2004, secondary energy use increased by 22.9 percent and related GHG emissions increased by 23.9 percent. The GHG intensity of energy changed slightly during the period as fuel switching towards less GHG-intensive fuels offset a higher GHG intensity in electricity production. The industrial sector is the largest energy user, accounting for 38.4 percent of total secondary energy use in 2004. The transportation sector is the second largest energy user at 28.9 percent, followed by the residential sector at 16.6 percent, the commercial/institutional sector at 13.7 percent and the agriculture sector at 2.4 percent.
Energy Intensity / Energy Efficiency
Aggregate energy intensity is the ratio of energy use per unit of GDP or, alternatively, energy use per capita. Aggregate energy intensity is sometimes used as a proxy for energy efficiency because it is simple and straightforward and the data for the calculation are readily available. However, this measure is misleading because, in addition to pure energy efficiency, intensity captures impacts such as weather variations and changes in the structure of the economy.
To properly gauge changes in energy efficiency over time, differences in economic structure and weather need to be normalized or factored out of the intensity calculation. Natural Resources Canada's (NRCan's) Office of Energy Efficiency (OEE) applies an internationally recognized factorization analysis technique to isolate the impact of energy efficiency on changes in Canadian energy use.
Figure 1-1 compares, for Canada, an index of annual variation in energy intensity with the OEE's index of changes in energy efficiency over the period 1990 to 2004. The indexes present improvements in energy intensity and efficiency as a downward trend.
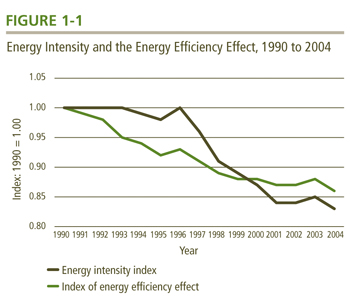
TABLE 1-1
| GJ* per capita | GJ* per $1,000 of GDP** | ||
|---|---|---|---|
| Luxembourg | 375.4 | Czech Republic | 18.5 |
| Canada | 261.4 | Hungary | 15.4 |
| United States | 226.0 | Turkey | 11.9 |
| Finland | 210.8 | Canada | 10.8 |
| Norway | 192.0 | Korea | 10.0 |
| Belgium | 172.2 | New Zealand | 9.5 |
| Sweden | 167.3 | Finland | 8.7 |
| Netherlands | 160.3 | Portugal | 8.1 |
| Australia | 151.2 | Luxembourg | 8.0 |
| New Zealand | 137.8 | Belgium | 7.6 |
* Gigajoules
** GDP is in constant 1995 US$ converted at exchange rate.
International Comparisons
Canada has a higher aggregate intensity – absolute energy use per capita or per unit of GDP – than most International Energy Agency (IEA) countries, ranking second and fourth, respectively.
Meaningful comparisons of energy efficiency between countries can be difficult because very detailed energy, equipment stock, production and/or weather data for each target country are required.
However, according to a recent IEA report entitled Oil Crises and Climate Challenges – 30 Years of Energy Use in IEA Countries, Canada's energy efficiency improved at an average annual rate of 1 percent between 1990 and 1998. This rate was similar to that of the United States and was the fourth fastest rate among the 13 countries included in the report (surpassed by the Czech Republic, Hungary and Turkey).
Trends in Energy Efficiency
Every year, NRCan publishes Energy Efficiency Trends in Canada, which reports on changes in energy use (and GHG emissions) and the contribution of the following key factors to these changes:
- Increases in sector activity lead to increased energy use and emissions. In the residential sector, for example, an increase in the number of households results in increased energy use.
- Fluctuations in weather lead to changes in space-heating and space-cooling requirements. A colder winter or a warmer summer can lead to increased energy use.
- A shift in the structure of activity toward more energy-intensive components of activity leads to increased energy use and emissions. For example, if the distribution of activity in the industrial sector shifts from forestry to the iron and steel industry, industrial energy use will increase because the former sector is less energy intensive than the latter.
- A higher service level for auxiliary equipment (e.g. computers, fax machines and photocopiers) increases energy use and emissions. This factor is only applied to commercial/institutional buildings. During the 1990s, these types of equipment were widely adopted; however, improvements in functionality increased productivity and moderated increases in energy consumption owing to the use of more machines.
- Energy efficiency refers to how effectively energy is being used – for example, how long an appliance can be operated with a given amount of energy.
In this report, changes in energy efficiency are the net result after allowing for the changes in energy use due to changes in activity, weather, structure and service level. To the extent that other factors that affect energy use have not been captured, this measure of energy efficiency improvement may overstate or understate the "actual" change. For example, in the industrial sector, in an industry such as other manufacturing, there may have been changes in energy use due to shifts in the mix of products, but this is not captured.
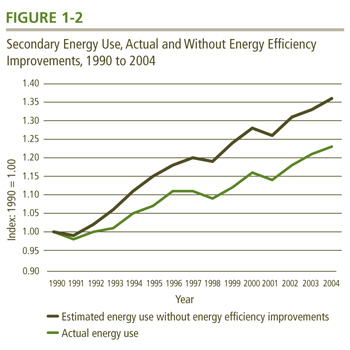
Secondary energy use increased between 1990 and 2004 (from 6951 to 8543 petajoules). Without improvements in energy efficiency, increases attributable to activity, weather, structure and service level would have led to an increase in secondary energy use of 35.9 percent. However, as a result of a 13.6 percent (903 petajoules) improvement in energy efficiency,¹ actual secondary energy use increased by 22.9 percent to 8543 petajoules.
The change in energy use between 1990 and 2004, actual and without energy efficiency improvements, is shown in Figure 1-2. The difference in energy use due to energy efficiency – the estimated energy saving – represents a reduction in energy costs of $14.5 billion in 2004 and a reduction in GHG emissions of almost 54 megatonnes. Changes in energy efficiency are estimated for each of the four major end-use sectors and are presented in Chapters 3 to 6. The energy efficiency improvements were largest in the residential sector (21.0 percent), followed by the transportation sector (17.6 percent), industrial sector (11.5 percent), and commercial/institutional sector (0.4 percent). ²
TABLE 1-2
| Sectors | |||||||
|---|---|---|---|---|---|---|---|
| Res. | Com./ Inst. |
Ind. | Trans. | Total** | % Change | ||
| 1990 energy use (PJ)* | 1289.4 | 867.0 | 2717.4 | 1877.9 | 6950.8 | ||
| 2004 energy use (PJ) | 1420.8 | 1171.2 | 3277.5 | 2465.1 | 8543.3 | ||
| Change in energy use (PJ) |
131.5 | 304.2 | 560.1 | 587.2 | 1592.5 | 22.9% | |
| Explanatory Factor (change due to) | |||||||
| Activity | 331.02 | 218.55 | 1097.78 | 669.98 | 2317.33 | 33.3% | |
| Weather | 25.56 | 10.95 | n/a | n/a | 36.51 | 0.5% | |
| Structure | 45.96 | 3.26 | -223.86 | 197.43 | 22.80 | 0.3% | |
| Service level | n/a | 75.47 | n/a | n/a | 75.47 | 1.1% | |
| Energy efficiency | -271.06 | -3.05 | -313.86 | -314.69 | -902.66 | -13.0% | |
| Other factors | -1.01 | 34.49 | 43.03 | 0.6% | |||
*Petajoules
**Total also includes energy use for agriculture (not shown in table).
Trends in Renewable Energy
As previously noted, changes in the fuel mix used by the Canadian economy can reduce GHG intensity. Although over the near term this can be achieved by moving from more to less GHG-intensive fuels (e.g. from coal to natural gas), over the longer term the use of renewable energy sources is expected to accelerate this trend.
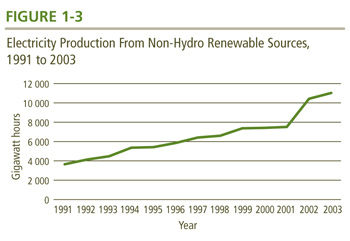
Figure 1-3 shows the trend in the use of electricity generated non-hydro renewable energy sources such as wind, solar and biomass in Canada, indicating a 302 percent increase over the period 1991–2003. Although representing only a small component of overall electricity use, the proportion of electricity generated from these renewable energy sources increased from 0.8 percent to 1.9 percent over the same period, representing a 257 percent increase in its share. While most of this production was derived from biomass, the share of wind power is increasing rapidly.
The graph does not include hydro sources, either conventional or small (less than 50 megawatts). The former accounts for 58.6 percent of electricity generated in Canada; installed capacity is about 68 gigawatts. The small hydro installed generating capacity of 3300 megawatts provided about 2 percent of electricity generated in Canada.
¹ Based on the OEE Index.
² The aggregate energy-use data presented in this report are taken from Statistics Canada's Report on Energy Supply-Demand in Canada (RESD). Differences exist between this report and Canada's Emissions Outlook: An Update (CEO Update) concerning the sector allocations of RESD energy use data. The CEO Update's sector allocation is based on Environment Canada's Trends in Canada's Greenhouse Gas Emissions 1990–1997, whereas this report uses a definition better suited for energy end-use analysis. Some modifications to the original Statistics Canada data were required and are documented in Appendix A of Natural Resources Canada's Energy Use Data Handbook, 1990 and 1997 to 2004.