Energy Use in the Industrial Sector

  • Home page
  • Total economy
  • Residential sector
  • Commercial sector
  • Industrial sector
  • Transportation sector

Photo of a refinery

The Office of Energy Efficiency at Natural Resources Canada has changed the base year from 1990 to 2000. This change was made to ensure that our data reflects developments in trends and structures of Canada’s energy end use and efficiency across sectors. It also synchronizes reporting on Canada’s energy use data with changes recently made by the International Energy Agency.

Highlights (excluding the resource extraction industry)

As a result of energy efficiency improvements since 2000, in 2019:
  • Energy efficiency in the industrial sector improved by 5.2%, saving Canadian industries 137.2 PJ in energy and $1.5 billion in associated costs in 2019.
  • Industrial energy use decreased 14.6%, but it would have only decreased 9.4% without energy efficiency improvements.
  • Energy efficiency helped avoid 5.6 Mt in GHG emissions.

Overview Overview – Energy use and GHG emissions

Industrial infographic
Text version

Distribution of industrial energy use by fuel type, 2019

Industrial energy use Percentage
Natural gas 43
Electricity 20
Still gas and petroleum coke 12
Wood waste and pulping liquor 10
Oil 8
Other 7

The industrial sector spent $42.7 billion on energy in 2019, and used 39.0% of total secondary energy, the most of any sector. It accounted for 35.4% of total GHG emissions, second only to the transportation sector due to its relatively lower emission intensive fuel mix. Major activities in the industrial sector include manufacturing, resource extraction, forestry, and construction.

4_3.png
Text version

Distribution of industrial energy use and activity by industry, 2019 (percentage)

Industry GDP Energy use
Construction 28.1 3.0
Forestry 1.0 0.7
Resource extraction (including oil sands extraction) 31.6 39.9
Manufacturing 39.2 56.5

Gross domestic product (GDP) and energy use are not always proportional. The construction industry is an outlier as it uses less energy to generate each dollar of GDP compared to other industries.

Energy efficiency Energy efficiency

Without energy efficiency gains, energy use in the industrial sector (excluding the resource extraction industry) would have only decreased 9.4% instead of 14.6%.

Using the factorization method, energy efficiency improvement can be measured by estimating the difference between the total change in industrial energy use (excluding resource extraction industry) and the impacts of activity and structure effects.

4_8.png
Text version

Impact of activity, structure and energy efficiency on the change in industrial energy use, 2000–2019

Petajoules
Total change in energy use 612.6
Activity effect 1,600.7
Structure effect -1,226.0
Energy efficiency effect 237.9
  • Activity effect – Industrial activity resulted in an increase of 1,131.4 PJ in energy and 46.5 Mt in GHG emissions.
  • Structure effect – The structural changes in the industrial sector, specifically, a relative decrease in the activity energy-intensive industries (i.e. pulp and paper), resulted in a decrease of 1,382.5 PJ in energy and 56.8 Mt in GHG emissions.
  • Energy efficiency effect – The 5.2% improvement in the energy efficiency saved 137.2 PJ in energy, $1.5 billion in costs and 5.6 Mt of GHG emissions. The 2008-2010 economic recession affected the efficiency of the industrial sector as industrial facilities were underutilized. As a result, savings from energy efficiency during economic recessions can be negative.

    Industrial energy use, with and without energy efficiency improvements (without resource extraction industries), 2000–2019 (petajoules)

    4_9.png
    Text version

    Industrial energy use, with and without energy efficiency improvements (without resource extraction industries), 2000–2019 (petajoules)

    Energy use with energy efficiency improvements Energy use without energy efficiency improvements
    2000 2,661.1 2,661.1
    2001 2,510.9 2,569.4
    2002 2,610.3 2,692.5
    2003 2,576.3 2,656.7
    2004 2,754.2 2,687.9
    2005 2,644.8 2,689.0
    2006 2,599.0 2,657.5
    2007 2,578.1 2,646.2
    2008 2,426.5 2,504.1
    2009 2,200.1 2,147.0
    2010 2,230.7 2,336.6
    2011 2,278.3 2,386.3
    2012 2,265.7 2,358.2
    2013 2,286.4 2,377.4
    2014 2,308.2 2,420.4
    2015 2,267.4 2,444.0
    2016 2,229.9 2,466.0
    2017 2,281.0 2,500.8
    2018 2,262.7 2,493.2
    2019 2,272.9 2,410.1

Energy use Energy use

From 2000 to 2019, total industrial energy use increased 19.3% from 3,167 to 3,780 PJ. The associated GHG emissions increased 12.6% over the same period from 160.5 Mt to 180.7 Mt. Without the resource extraction industry, industrial energy use decreased 14.6%, and the associated GHG emissions decreased 27.3%.

Natural gas use increased significantly (+69.3%). Meanwhile, heavy fuel oilFootnote 1 (HFO) and coke and coke oven gas use decreased significantly (-79.6% and -22.2%, respectively). While industrial sector electricity use decreased 5.0%, emissions from electricity use decreased 48.1% due to increased renewable electricity generation. The shift toward lower emission-intensive fuels resulted in lower growth in GHG emissions.

4_11.png
Text version

Industrial energy use by fuel type, 2000 and 2019 (petajoules)

2000 2019
Electricity 795.5 758.9
Natural gas 961.0 1,600.6
Oil 284.6 309.6
Still gas and petroleum coke 375.9 443.0
Wood waste and pulping liquor 479.5 377.4
Other 270.5 249.9

Manufacturing Manufacturing energy use

4_12.png
Text version

Share of energy consumption in the Manufacturing sector, 2019

Percentage
Pulp and paper (NAICS code 322) 27
Smelting and refining (NAICS codes 3313, 3314 and 33152) 13
Iron and steel (NAICS codes 3311, 3312 and 33151) 10
Chemicals (NAICS code 325) 12
Petroleum refining (NAICS code 324110) 14
Cement (NAICS code 327310) 3
Wood products (NAICS code 321) 3
Other ManufacturingFootnote * 18

Canada’s manufacturing industry was responsible for 22.0% of total final consumption of energy in 2019. This subsector’s energy use decreased 17.7% compared to 2000, largely driven by lower paper manufacturing production. Five subsectors of the manufacturing industry (pulp and paper, smelting and refining, iron and steel, chemicals and petroleum refining), as specified in the Report on Energy Supply and Demand in Canada, accounted for about three-quarters of the industry’s energy consumption.

Paper Manufacturing

4_13.png
Text version

Paper Manufacturing energy use by selected industry, 2000 and 2019 (petajoules)

2000 2019
Pulp mills 381.6 328.2
Paperboard mills 71.1 38.9
Paper mills (except newsprint) 117.1 82.1
Newsprint mills 274.7 67.1
Other 23.2 49.4
4_14.png
Text version

Paper Manufacturing GHG emissions by selected industry, 2000 and 2019 (petajoules)

2000 2019
Pulp mills 7.1 4.4
Paperboard mills 2.3 1.1
Paper mills (except newsprint) 3.7 1.7
Newsprint mills 11.0 1.6
Other 1.3 1.0

The Paper Manufacturing subsector is engaged in the manufacturing of pulp, paper and paper products; it is the main user of biomass as a source of energy.

In 2019, the subsector’s energy use decreased 34.8% compared to 2000, largely driven by significant declines in manufacturing activity in the paper mills (except newsprint) (-29.9%) and newsprint mills (-75.6%) industries. Associated GHG emissions decreased 60.9% since 2000 for the subsector.

Primary Metal Manufacturing

4_15.png
Text version

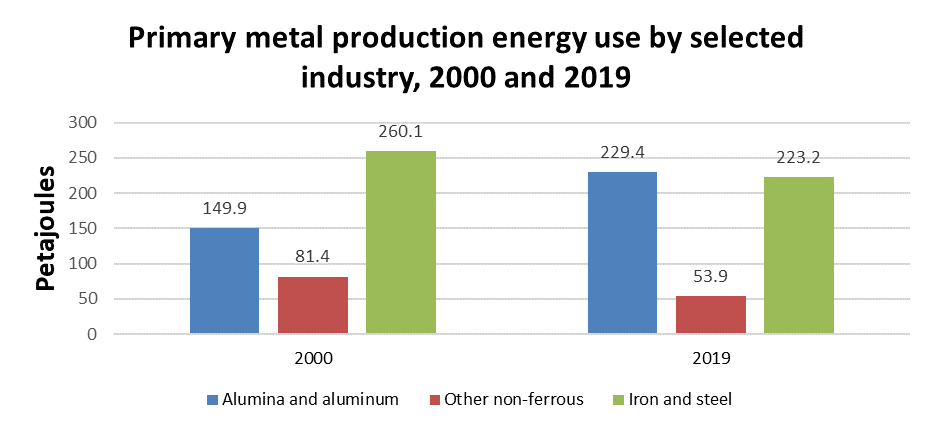
Primary metal production energy use by selected industry, 2000 and 2019 (petajoules)

2000 2019
Alumina and aluminum 149.9 229.4
Other non-ferrous 81.4 53.9
Iron and steel 260.1 223.2

Energy use for primary metal production increased (+3.1%) from 2000 to 2019, driven entirely by growing energy demand in alumina and aluminum production and in the smelting and refining industries for various metals.

Energy demand in the manufacturing of alumina and aluminum grew 53.0%, driven up by the 20.2% production increase. However, as electricity accounted for around 90% of its total energy consumption and electricity is gradually becoming cleaner, energy used in the production of alumina and aluminum emitted 11.3% less GHG emissions. Since 2000, this subsector’s contribution to GDP in the production of alumina and aluminum has increased 44.3%, from $1.9 billion in 2000 to $2.8 billion in 2019 ($2012).

Chemical Manufacturing and Petroleum Refining

Both chemical manufacturing and petroleum refining recorded considerable declines in energy needs in 2019 compared to 2000.

Energy use in chemical manufacturing decreased 5.3% from 2000 to 2019, largely due to lower energy demand in alkali and chlorine manufacturing. In 2019, natural gas (65.4% share) and electricity (29.1% share) accounted for the majority of the energy needs for the chemical manufacturing subsector. The associated GHG emissions decreased 23.1%.

Energy use in petroleum refining decreased 12.8%, while the production level of the petroleum refining industry was 7.4% lower in 2019 from that in 2000. The associated GHG emissions decreased 15.4% in 2019 compared to 2000, basically in line with the decreased energy use in the industry.

Wood Product Manufacturing

Energy use in the wood product manufacturing subsectorFootnote 2 decreased 3.0% in 2019 compared to 2000.

Associated GHG emissions decreased 42.6% between 2000 and 2019. The industries in this subsector are engaged in:

  • sawing logs into lumber and similar products, or preserving these products
  • making products that improve the natural characteristics of wood; for example, making veneers, plywood, reconstituted wood panel products or engineered wood assemblies
  • making a diverse range of wood products such as millwork.

Resource extraction Energy use in resource extraction

4_16.png
Text version

Industrial energy use by selected industry, 2000 and 2019 (petajoules)

2000 2019
Upstream mining (including oil, gas and oil sands extraction) 390 1,321
Pulp and paper 868 566
Petroleum refining 343 299
Chemicals 260 247
Iron and steel 260 223
Others (construction, forestry and other unspecified manufacturing subsectors) 1,046 1,124

This subsector comprises industries engaged in oil and gas extraction, coal mining, metal ore mining, non-metallic mineral mining, quarrying and support activities for mining and oil and gas extraction. The resource extraction industries accounted for 39.9% of total industrial energy use and 48.3% of total GHG emissions. The subsector’s energy use increased 198% and 1764 for associated GHG emissions, largely driven by rising activity in the oil sands. Daily bitumen and synthetic crude oil production increased 383% from 2000 to 2019. This jump in energy use led to a 49.9% increase in GDP from 2000 to 2019.

Energy intensity Energy intensity

4_10.png
Text version

Energy use intensity per GDP in Manufacturing and Resource Extraction, 2000 and 2018 (MJ/($2012 – GDP))

2000 2019
Manufacturing 12.0 10.7
Resource extraction 4.7 9.4

Resource extraction, manufacturing, construction and forestry did not contribute to energy savings proportional to their energy use. Energy consumption in the resource extraction sector increased 198% from 2000 to 2019. However, this higher energy use did not translate into higher energy savings over this period, as energy intensity (average energy use per unit of economic activity (GDP) was much higher in 2019, especially in the upstream mining sector (including oil and gas extraction). The manufacturing sector was the opposite with a strong performance in energy efficiency improvement.