Energy Efficiency Trends in Canada
![]()
The Office of Energy Efficiency at Natural Resources Canada has changed the base year from 1990 to 2000. This change was made to ensure that our data reflects developments in trends and structures of Canada’s energy end use and efficiency across sectors. It also synchronizes reporting on Canada’s energy use data with changes recently made by the International Energy Agency.
Highlights
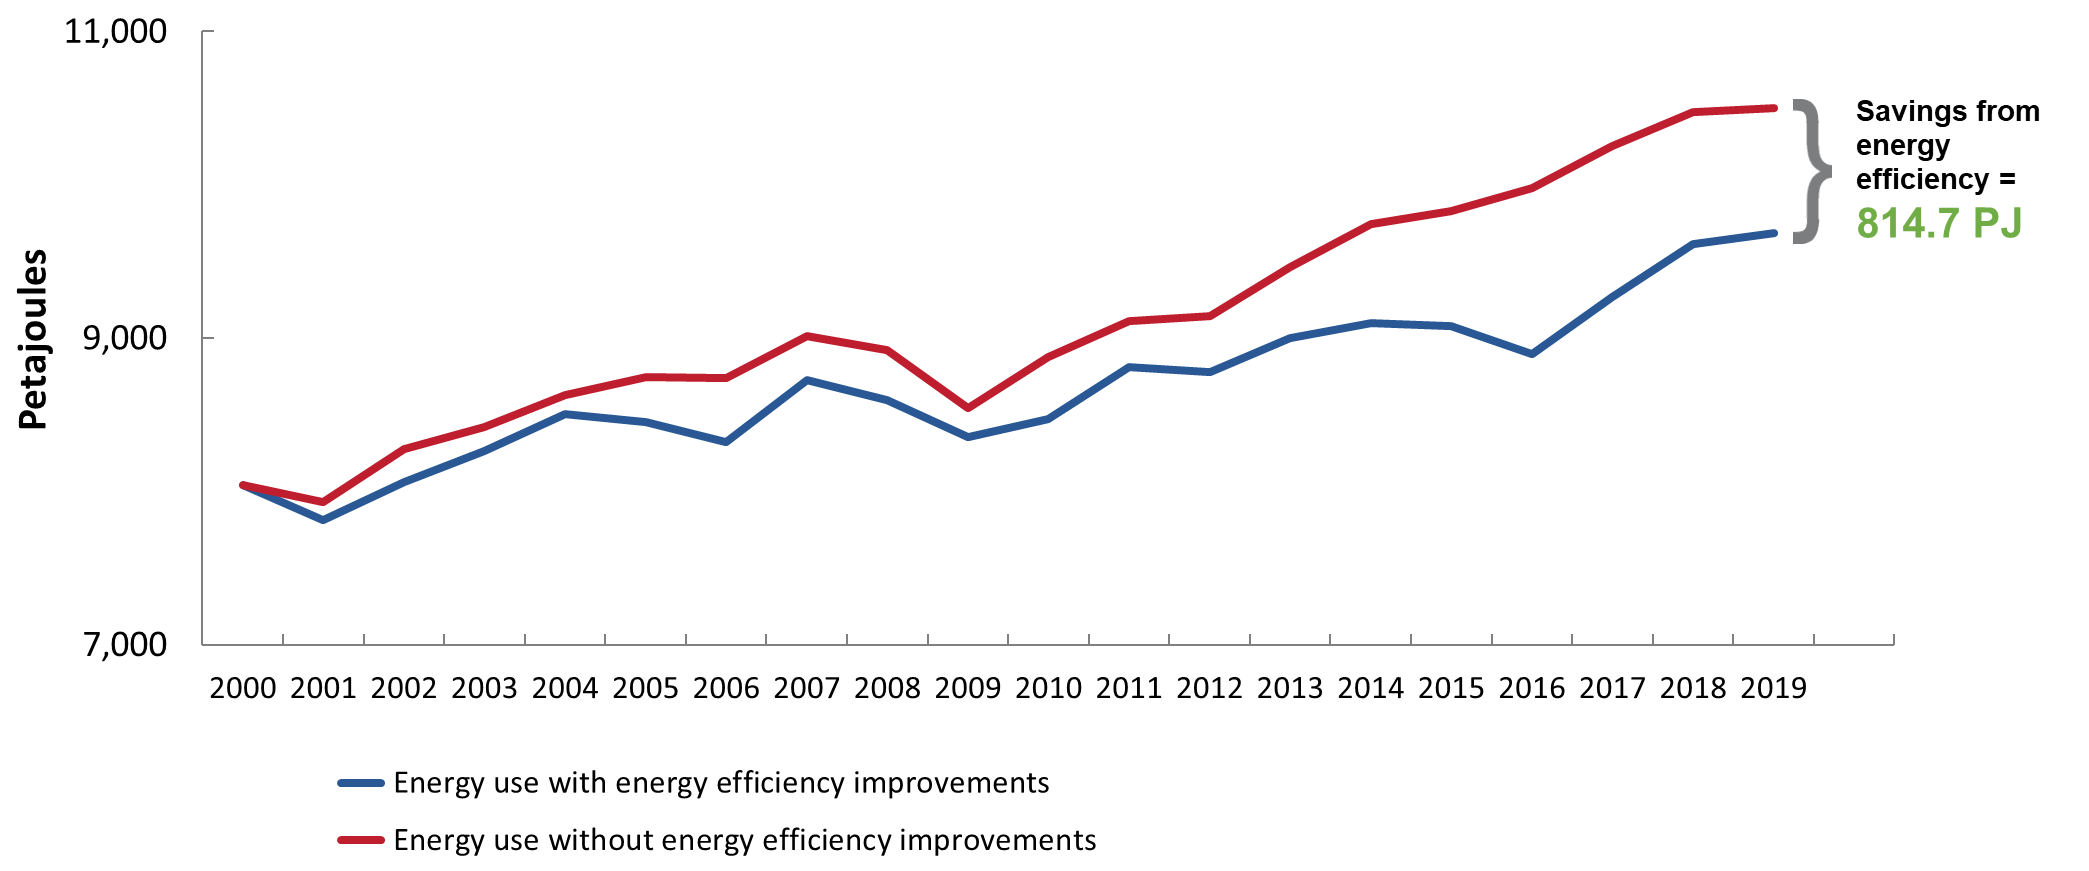
- Energy efficiency improved 12.3%, saving Canadians 814.7 PJ in energy and $23.2 billion in costs in 2019. Secondary energy use (final energy demand) in Canada increased 20.4%. It would have increased 30.5% without energy efficiency improvements.
- Energy efficiency helped avoid 45.7 Mt in GHG emissions in 2019.
- Canada’s energy intensity per unit of GDP improved 17.7%.
 Energy use
Under the Energy Efficiency Act, the Office of Energy Efficiency is mandated to measure, analyze and report on changes to secondary energy demand (i.e. energy efficiency improvements) in an annual report to Parliament.
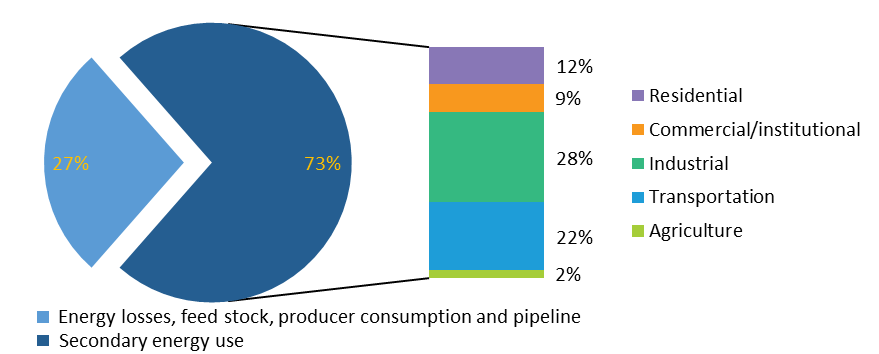
Primary and secondary energy use (final energy demand) by sector, 2019
Text version
Primary and secondary energy use (final energy demand) by sector, 2018
| Percentage | |||||||||||
|---|---|---|---|---|---|---|---|---|---|---|---|
| Energy losses, feed stock, producer consumption and pipeline | 28 | ||||||||||
| Secondary energy use | 72 | ||||||||||
|
|||||||||||
Secondary energy (or final energy demand/use) is the energy used directly by the final consumers in various sectors of the economy. This includes electricity, natural gas, refined petroleum product required to heat and cool homes or businesses in the residential and commercial/institutional, the energy used by vehicles in the transportation sector and the energy required to run machinery in the industrial and agricultural sectors. Secondary energy use accounted for 72.9% of the primary energy use in 2019, or 9,683.2 petajoules.
Primary (Total) energy encompasses the total demand for all users of energy. This includes, besides secondary energy use, the energy required to transform (energy losses) one form of energy to another (e.g. coal to electricity), the energy used to bring energy supplies to the consumer (e.g. pipeline), and the energy used to feed industrial production processes (e.g. the natural gas used as feedstock by the chemical industries). In 2019, the total amount of primary energy consumed was 13,276.4 PJ.
Text version
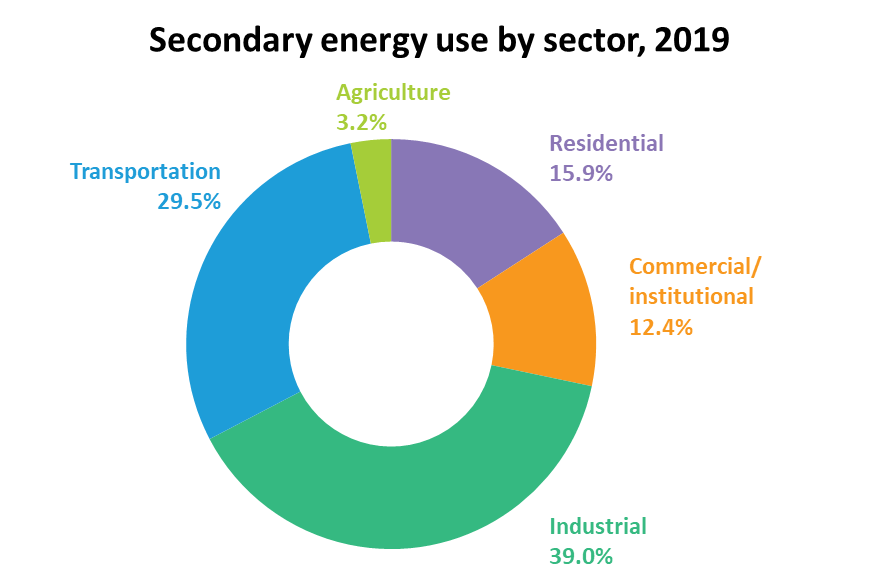
Secondary energy use by sector, 2019
| Distribution of energy use | Percentage |
|---|---|
| Residential | 15.9 |
| Commercial/institutional | 12.4 |
| Industrial | 39.0 |
| Transportation | 29.5 |
| Agriculture | 3.2 |
Text version
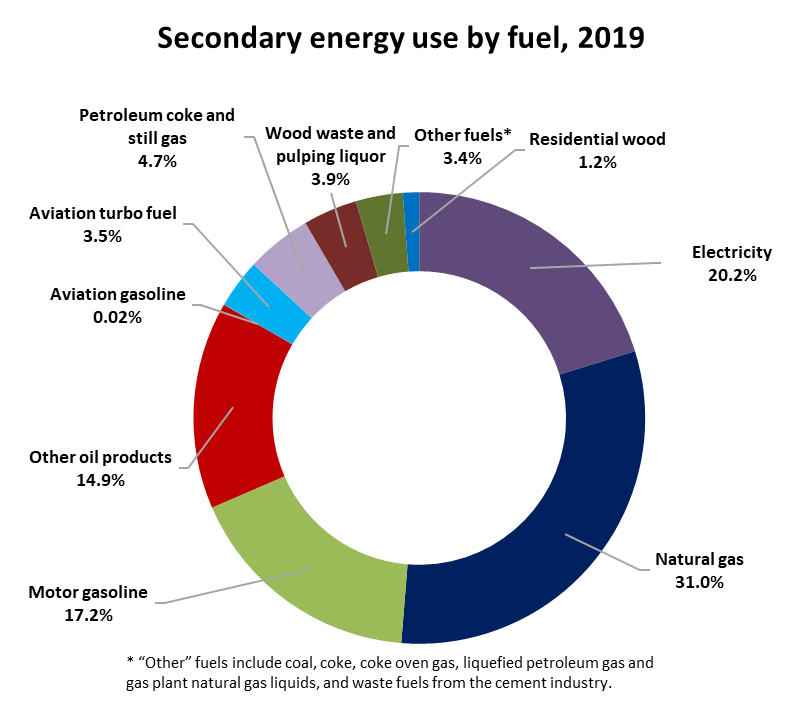
Secondary energy use by fuel type, 2019
| Distribution of energy use | Percentage |
|---|---|
| Electricity | 20.2 |
| Natural gas | 31.0 |
| Motor gasoline | 17.2 |
| Other oil products | 14.9 |
| Aviation gasoline | 0.02 |
| Aviation turbo fuel | 3.5 |
| Petroleum coke and still gas | 4.7 |
| Wood waste and pulping liquor | 3.9 |
| Other fuelsFootnote * | 3.4 |
| Residential wood | 1.2 |
Text version
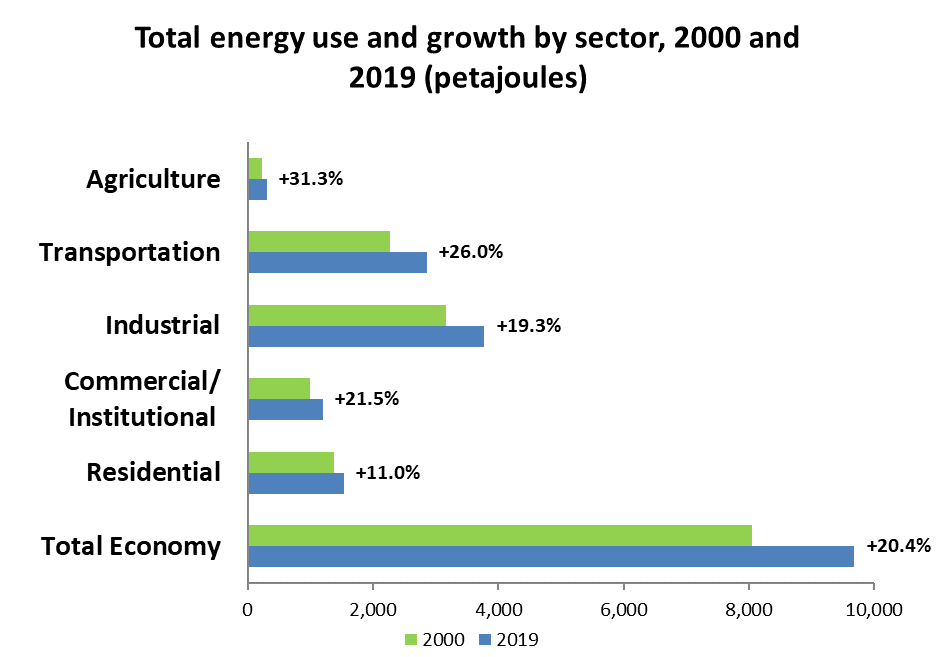
Total energy use and growth by sector, 2000 and 2019 (petajoules)
| 2000 | 2019 | Growth/decrease | |
|---|---|---|---|
| Residential | 1,384 | 1,536 | 11.0% |
| Commercial/Institutional | 990 | 1,204 | 21.5% |
| Industrial | 3,167 | 3,780 | 19.3% |
| Transportation | 2,266 | 2,856 | 26.0% |
| Agriculture | 235 | 308 | 31.3% |
| Total Economy | 8,042 | 9,683 | 20.4% |
 Energy intensity
Many organizations (e.g. International Energy Agency) use energy intensity as a proxy for energy efficiency. While the two metrics tend to move in parallel, they do not constitute the same measurement. Canada has developed a more sophisticated factorization analysis – one that disaggregates the multiple effects affecting energy use – to more accurately estimate actual energy efficiency improvements (see the Energy Efficiency section).
Energy intensity is a measure of the energy inefficiency of an economy and calculated as units of energy per GDP. High energy intensity indicates a high cost of converting energy into GDP. Many factors influence overall energy intensity such as standard of living, weather conditions, vehicular distances travelled, methods and patterns of transportation (mass transit), off-grid energy sources, new energy sources, energy disruptions (power blackout) and energy efficiency.
Text version
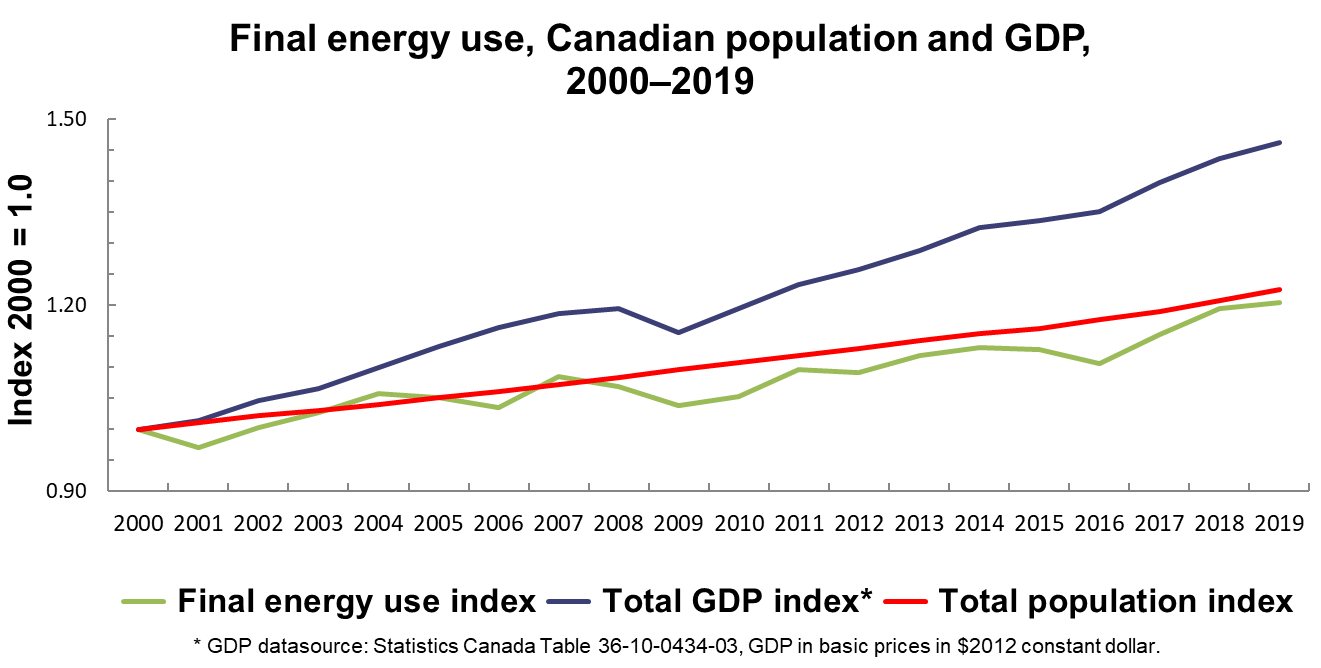
Final energy use, Canadian population and GDP, 2000–2019 (Index 2000=1)
| Final energy use index | Total GDP indexFootnote * | Total population index | |
|---|---|---|---|
| 2000 | 1.00 | 1.00 | 1.00 |
| 2001 | 0.97 | 1.02 | 1.01 |
| 2002 | 1.00 | 1.05 | 1.02 |
| 2003 | 1.03 | 1.07 | 1.03 |
| 2004 | 1.06 | 1.10 | 1.04 |
| 2005 | 1.05 | 1.13 | 1.05 |
| 2006 | 1.04 | 1.16 | 1.06 |
| 2007 | 1.08 | 1.19 | 1.07 |
| 2008 | 1.07 | 1.19 | 1.08 |
| 2009 | 1.04 | 1.16 | 1.10 |
| 2010 | 1.05 | 1.20 | 1.11 |
| 2011 | 1.10 | 1.23 | 1.12 |
| 2012 | 1.09 | 1.26 | 1.13 |
| 2013 | 1.12 | 1.29 | 1.14 |
| 2014 | 1.13 | 1.33 | 1.15 |
| 2015 | 1.13 | 1.34 | 1.16 |
| 2016 | 1.11 | 1.35 | 1.18 |
| 2017 | 1.15 | 1.40 | 1.19 |
| 2018 | 1.20 | 1.44 | 1.21 |
| 2019 | 1.20 | 1.46 | 1.23 |
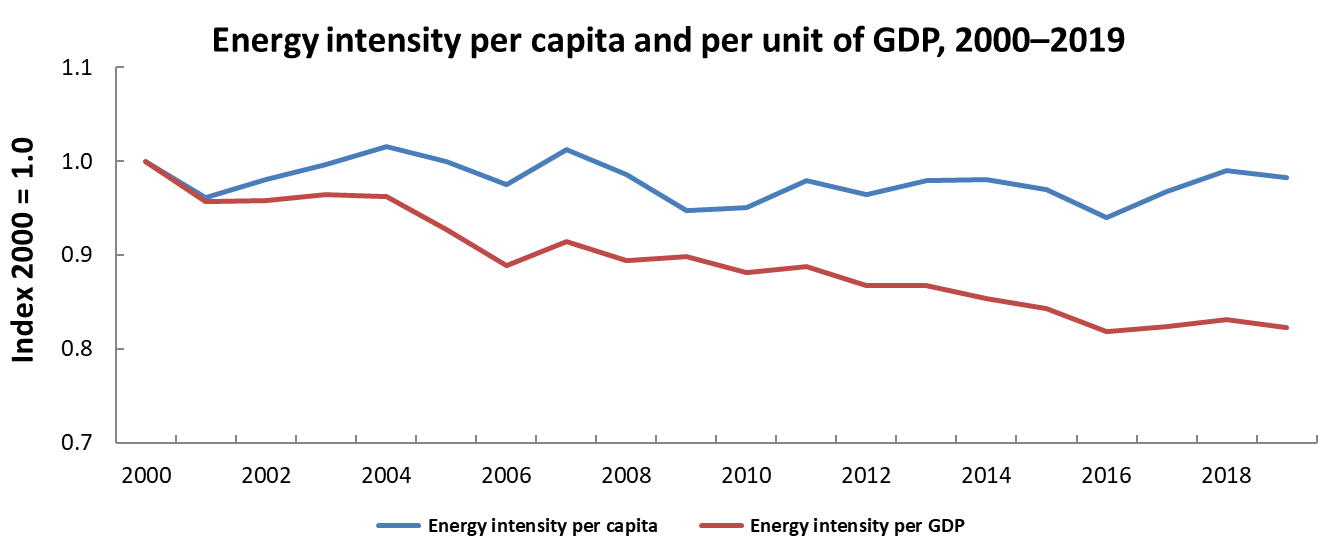
In Canada, energy intensity improved 17.7% between 2000 and 2019, reflecting a significant overall improvement of how effectively Canadians used energy to produce GDP.
Text version
Energy intensity per capita and per unit of GDP, 2000–2019 (Index 2000=1.0)
| Energy intensity per capita | Energy intensity per GDP | |
|---|---|---|
| 2000 | 1.00 | 1.00 |
| 2001 | 0.96 | 0.96 |
| 2002 | 0.98 | 0.96 |
| 2003 | 1.00 | 0.96 |
| 2004 | 1.02 | 0.96 |
| 2005 | 1.00 | 0.93 |
| 2006 | 0.98 | 0.89 |
| 2007 | 1.01 | 0.91 |
| 2008 | 0.99 | 0.89 |
| 2009 | 0.95 | 0.90 |
| 2010 | 0.95 | 0.88 |
| 2011 | 0.98 | 0.89 |
| 2012 | 0.96 | 0.87 |
| 2013 | 0.98 | 0.87 |
| 2014 | 0.98 | 0.85 |
| 2015 | 0.97 | 0.84 |
| 2016 | 0.94 | 0.82 |
| 2017 | 0.97 | 0.82 |
| 2018 | 0.99 | 0.83 |
| 2019 | 0.98 | 0.82 |
 Energy efficiency
The International Energy Agency denotes energy efficiency as the world’s “first fuel of economic development”. Energy efficiency has multiple economic and environmental benefits, including being the cheapest option to reduce GHG emissions.
Text version
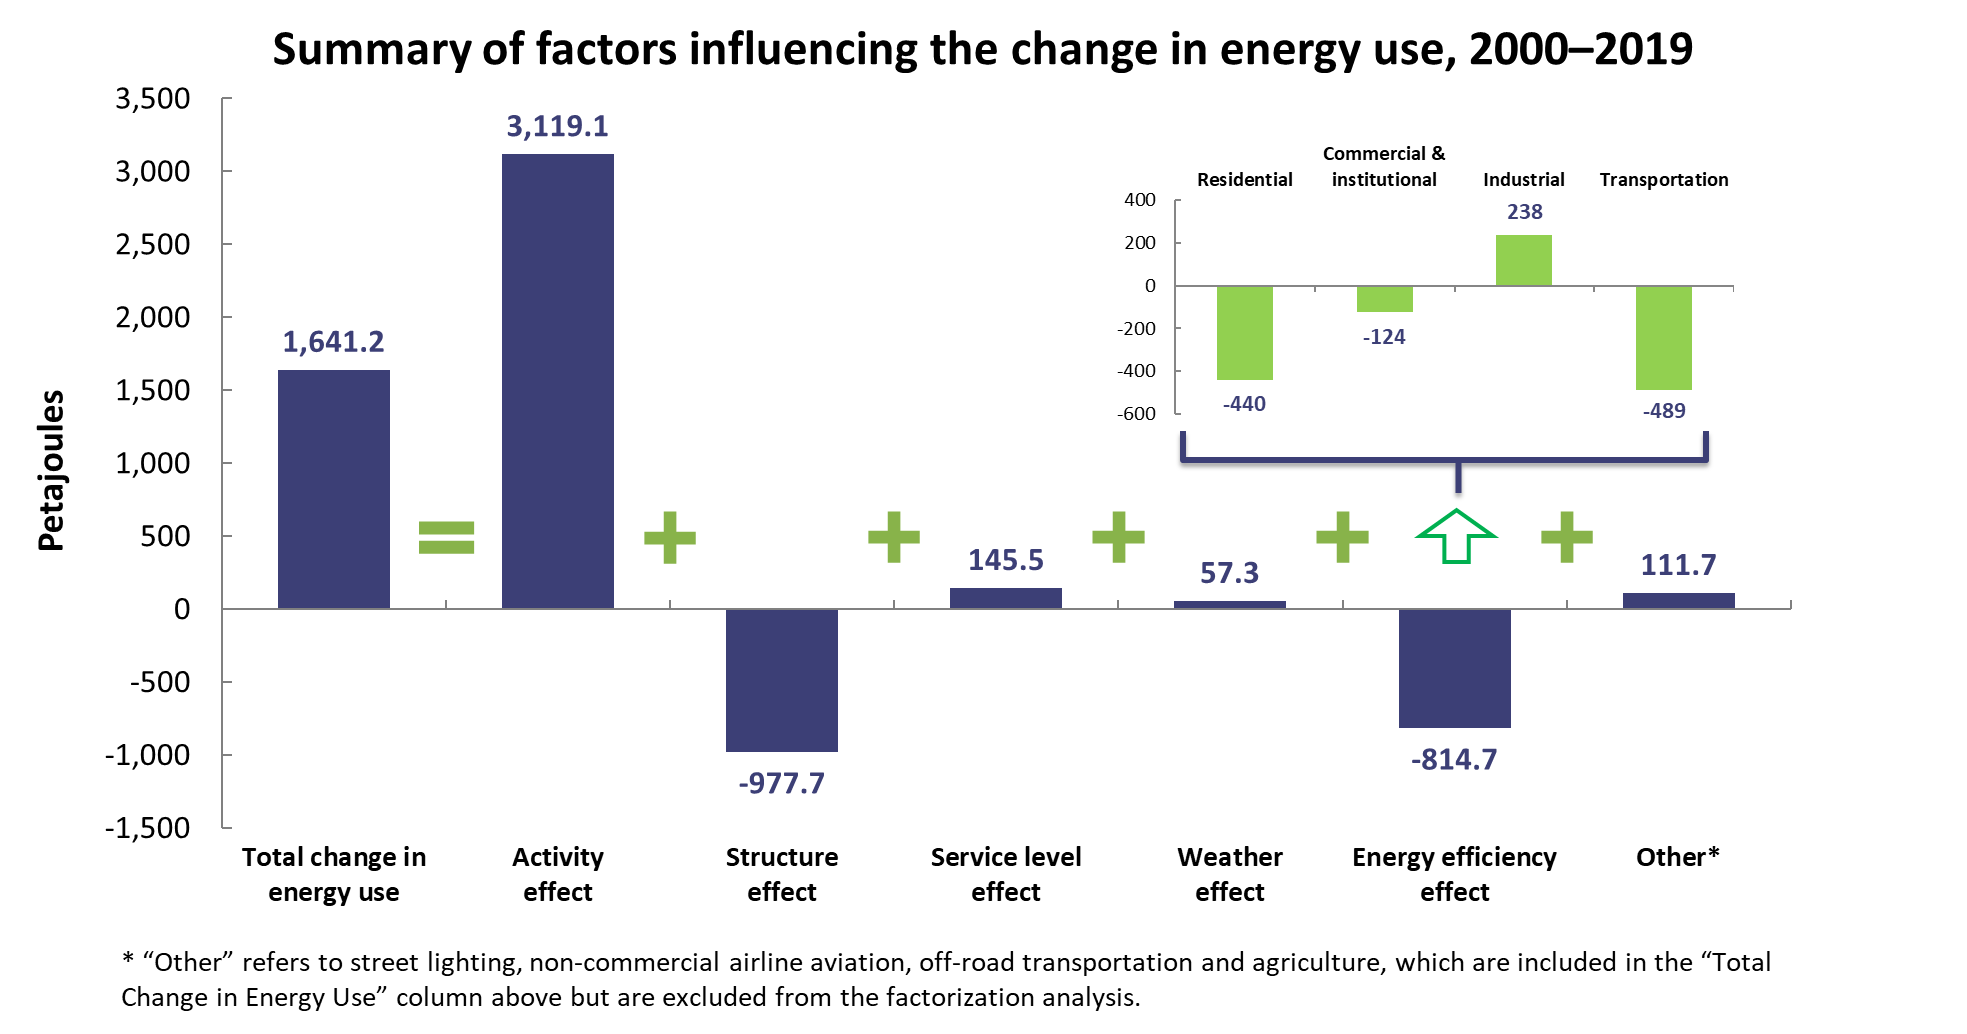
Summary of factors influencing the change in energy use, 2000–2019
| Petajoules | |
|---|---|
| Total change in energy use | 1,641.2 |
| Activity effect | 3,119.1 |
| Structure effect | -977.7 |
| Service level effect | 145.5 |
| Weather effect | 57.3 |
| Energy efficiency effect | -814.7 |
| OtherFootnote * | 111.7 |
Natural Resources Canada (NRCan) isolates and tracks the amount of energy saved through energy efficiency by identifying and measuring other factors that impact energy use:
- The activity effect is the increase in energy use due to economic growth, which resulted in an increase of 3,119 PJ in energy and 161.2 Mt in GHG emissions.
- The structure effect is how the changing composition of the economy influences energy use. For example, some industries may have growing subsectors that are more or less energy-intensive than others. The structural changes in the Canadian economy resulted in a decrease of 977.7 PJ in energy and 41.9 Mt in GHG emissions.
- The weather effect measures the impact of hotter or colder temperatures on energy use. In 2019, the winter was slightly colder than in 2000 and the summer was hotter, resulting in an increase of 57.3 PJ in energy and 2.3 Mt more in GHG emissions.
- The service level effect measures the increased use of equipment in homes and businesses. As the economy has become more digital, energy use has increased both at home and at work. The changes in service level resulted in an increase of 145.5 PJ in energy and 6.1 Mt in GHG emissions.
- The energy efficiency effect is the balance of the total change in energy use over time (2000–2019) minus the impact of the identified factors above. In 2019, the 12.3% improvement in energy efficiency for the Canadian economy saved 814.7 PJ in energy and avoided 45.7 Mt in GHG emissions.
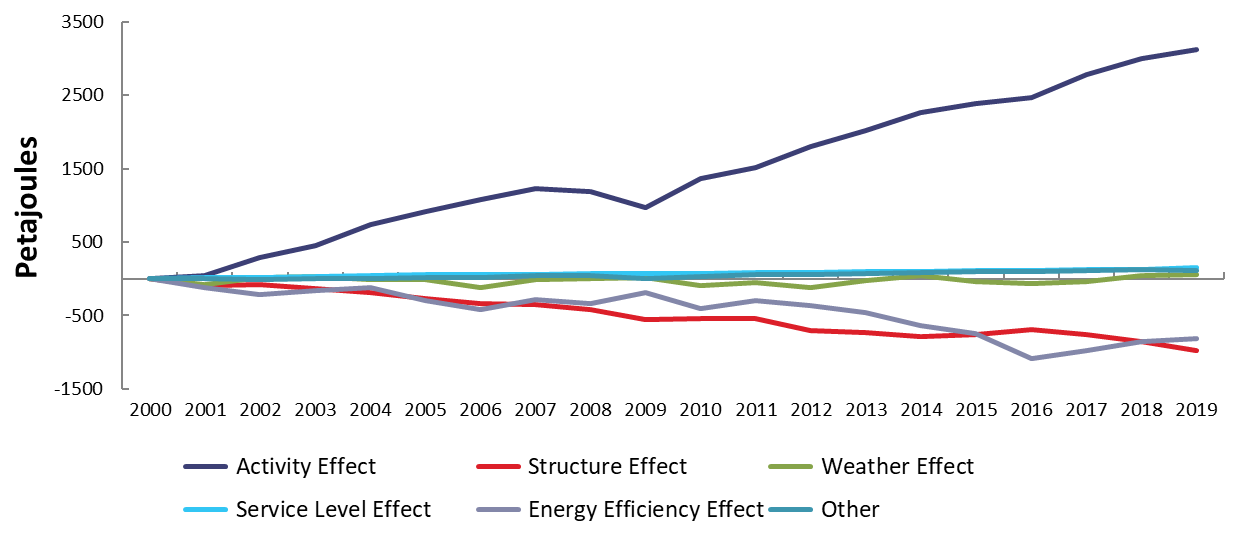
Historical trends of factors influencing final energy use, 2000–2019 (petajoules)
Text version
Historical trends of factors influencing final energy use, 2000–2019 (petajoules)
| Activity effect | Structure effect | Weather effect | Service level effect | Energy efficiency effect | Other | |
|---|---|---|---|---|---|---|
| 2000 | 0 | 0 | 0 | 0 | 0 | 0 |
| 2001 | 48 | -87 | -84 | 12 | -119 | 0 |
| 2002 | 292 | -83 | 9 | 22 | -215 | -7 |
| 2003 | 450 | -129 | 25 | 33 | -155 | -1 |
| 2004 | 740 | -188 | -17 | 41 | -122 | 8 |
| 2005 | 913 | -264 | -16 | 51 | -293 | 19 |
| 2006 | 1,080 | -335 | -122 | 57 | -416 | 20 |
| 2007 | 1,226 | -349 | -10 | 61 | -286 | 42 |
| 2008 | 1,187 | -414 | 0 | 67 | -332 | 44 |
| 2009 | 971 | -552 | 10 | 72 | -191 | -1 |
| 2010 | 1,360 | -541 | -94 | 76 | -402 | 33 |
| 2011 | 1,517 | -540 | -48 | 81 | -297 | 58 |
| 2012 | 1,796 | -710 | -126 | 88 | -366 | 52 |
| 2013 | 2,013 | -730 | -26 | 95 | -462 | 70 |
| 2014 | 2,262 | -790 | 45 | 101 | -641 | 81 |
| 2015 | 2,381 | -760 | -33 | 107 | -752 | 91 |
| 2016 | 2,473 | -686 | -61 | 116 | -1,082 | 98 |
| 2017 | 2,779 | -764 | -33 | 122 | -984 | 105 |
| 2018 | 2,994 | -855 | 40 | 131 | -861 | 120 |
| 2019 | 3,119 | -978 | 57 | 146 | -815 | 112 |
A steady increase in activity contributed the most to increased energy use. The structure effect shows a steady decrease of energy use, especially from 2005 onwards, resulting from a shift in production toward industries that are less energy-intensive (i.e. pulp and paper).
Energy efficiency improvement has been steady since 2000. However, the rate of improvement slowed down between 2008 and 2010, which can be attributed to slower economic growth during the 2008-2010 recession and contributing factors such as sub-optimal freight transportation.
Final energy use, with and without energy efficiency improvements, 2000–2019 (petajoules)
Text version
Final energy use, with and without energy efficiency improvements, 2000–2018 (petajoules)
| Energy use with energy efficiency improvements | Energy use without energy efficiency improvements | |
|---|---|---|
| 2000 | 8,042 | 8,042 |
| 2001 | 7,812 | 7,932 |
| 2002 | 8,061 | 8,276 |
| 2003 | 8,264 | 8,420 |
| 2004 | 8,505 | 8,627 |
| 2005 | 8,451 | 8,745 |
| 2006 | 8,325 | 8,742 |
| 2007 | 8,726 | 9,012 |
| 2008 | 8,593 | 8,925 |
| 2009 | 8,352 | 8,543 |
| 2010 | 8,473 | 8,876 |
| 2011 | 8,814 | 9,111 |
| 2012 | 8,777 | 9,143 |
| 2013 | 9,001 | 9,464 |
| 2014 | 9,102 | 9,742 |
| 2015 | 9,076 | 9,828 |
| 2016 | 8,899 | 9,981 |
| 2017 | 9,268 | 10,252 |
| 2018 | 9,613 | 10,473 |
| 2019 | 9,683 | 10,498 |
Without significant and ongoing energy efficiency improvements in end-use sectors, energy use would have increased 30.5% between 2000 and 2019 instead of 20.4%.
 GHG emissions
Text version
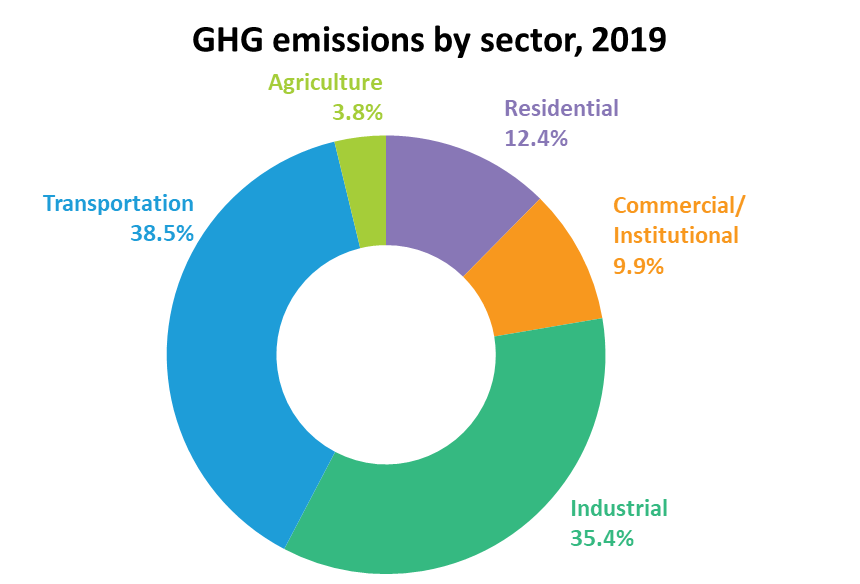
GHG emissions by sector, 2019
| Distribution of GHGs | Percentage |
|---|---|
| Residential | 12.4 |
| Commercial/institutional | 9.9 |
| Industrial | 35.4 |
| Transportation | 38.5 |
| Agriculture | 3.8 |
Text version
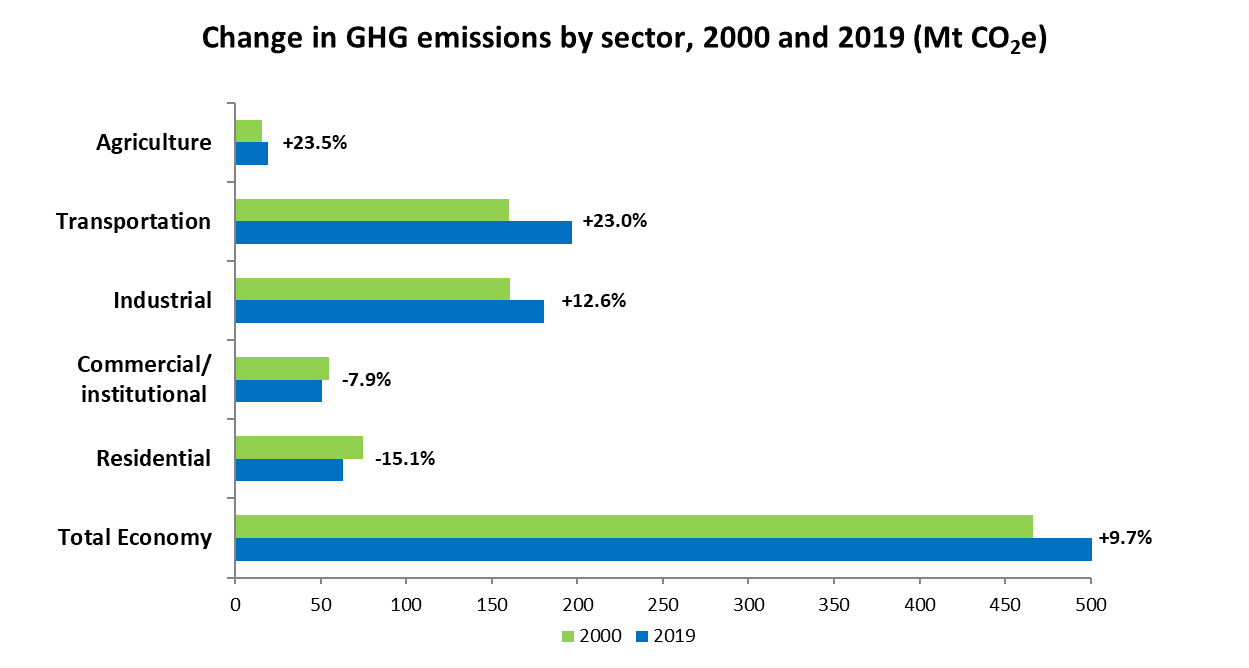
Change in GHG emissions by sector, 2000 and 2019 (Mt CO2e)
| 2000 | 2019 | Growth/decrease | |
|---|---|---|---|
| Agriculture | 15.6 | 19.3 | 23.5% |
| Transportation | 160.1 | 196.9 | 23.0% |
| Industrial | 160.5 | 180.7 | 12.6% |
| Commercial/institutional | 55.2 | 50.8 | -7.9% |
| Residential | 74.6 | 63.3 | -15.1% |
| Total Economy | 466.0 | 511.0 | 9.7% |
The increase in GHG emissions was significantly less than would otherwise have been because of the positive change in the fuel mix used to generate electricity. In particular, the share of coal used for electricity generation fell from 29.6% in 2000 to 13.1% in 2019.
The rapid growth of energy consumption and dominance of emission-intensive refined petroleum products are the primary reasons for making the transportation sector the highest source of GHG emissions in Canada in 2019.
Text version
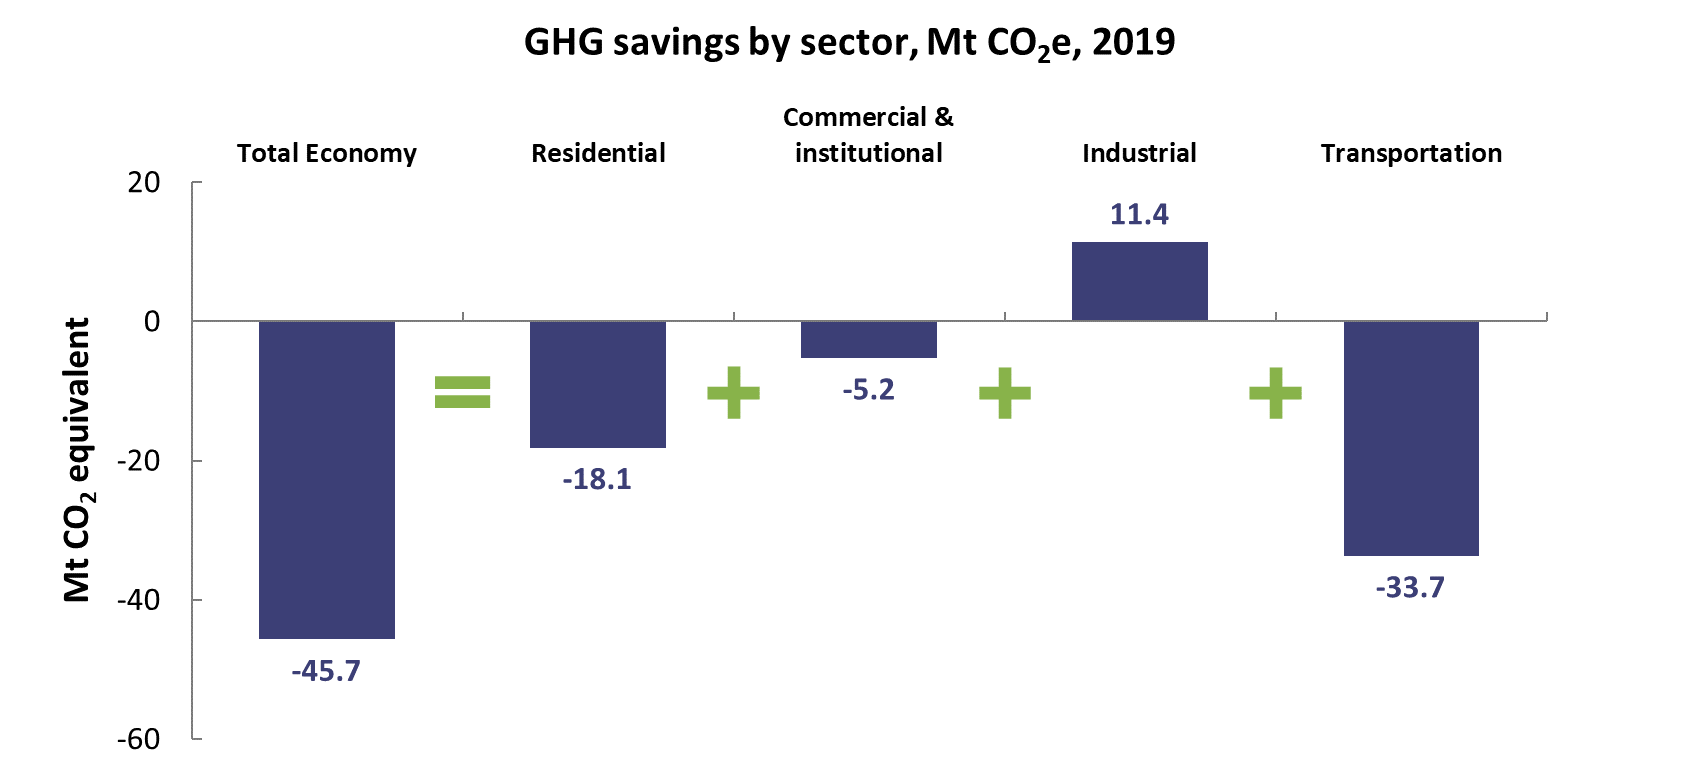
GHG savings by sector, 2018 (Mt CO2e)
| Mt CO2e | |
|---|---|
| Total economy | -45.7 |
| Residential | -18.1 |
| Commercial/institutional | -5.2 |
| Industrial | 11.4 |
| Transportation | -33.7 |
The transportation sector was the largest contributor at 73.7% of total GHG savings, largely driven by ongoing improvements in performance standards for passenger vehicles and light-duty trucks. Among other factors, there were awareness and education programs that increased fuel efficiency through maintenance and improved driving habits.
The residential sector contributed 39.7% to the total GHG savings through several mechanisms, including enhanced building codes, minimum energy performance standards (MEPS) for appliances, improved energy monitoring systems, and home retrofits.
The commercial/institutional sector contributed to 11.5% of total GHG savings.
The industrial sector however offset GHG emissions by 24.9%, mostly due to energy-intensive processes in oil and gas extractions after 2000. Without resource extraction industries, the industrial sector has avoided 5.6 Mt of GHG emissions in 2019 from energy efficiency improvements since 2000.