Energy Use in the Residential Sector
![]()
The Office of Energy Efficiency at Natural Resources Canada has changed the base year from 1990 to 2000. This change was made to ensure that our data reflects developments in trends and structures of Canada’s energy end use and efficiency across sectors. It also synchronizes reporting on Canada’s energy use data with changes recently made by the International Energy Agency.
Highlights
- Energy efficiency in the residential sector improved 32%, saving Canadians 440 PJ in energy and $8.5 billion in costs in 2019 – averaging $47/household per month.
- Residential energy use increased 11.0% in 2019, but it would have increased 42.7% without energy efficiency improvements.
- Energy efficiency helped avoid 18.1 Mt in GHG emissions in 2019.
 Overview
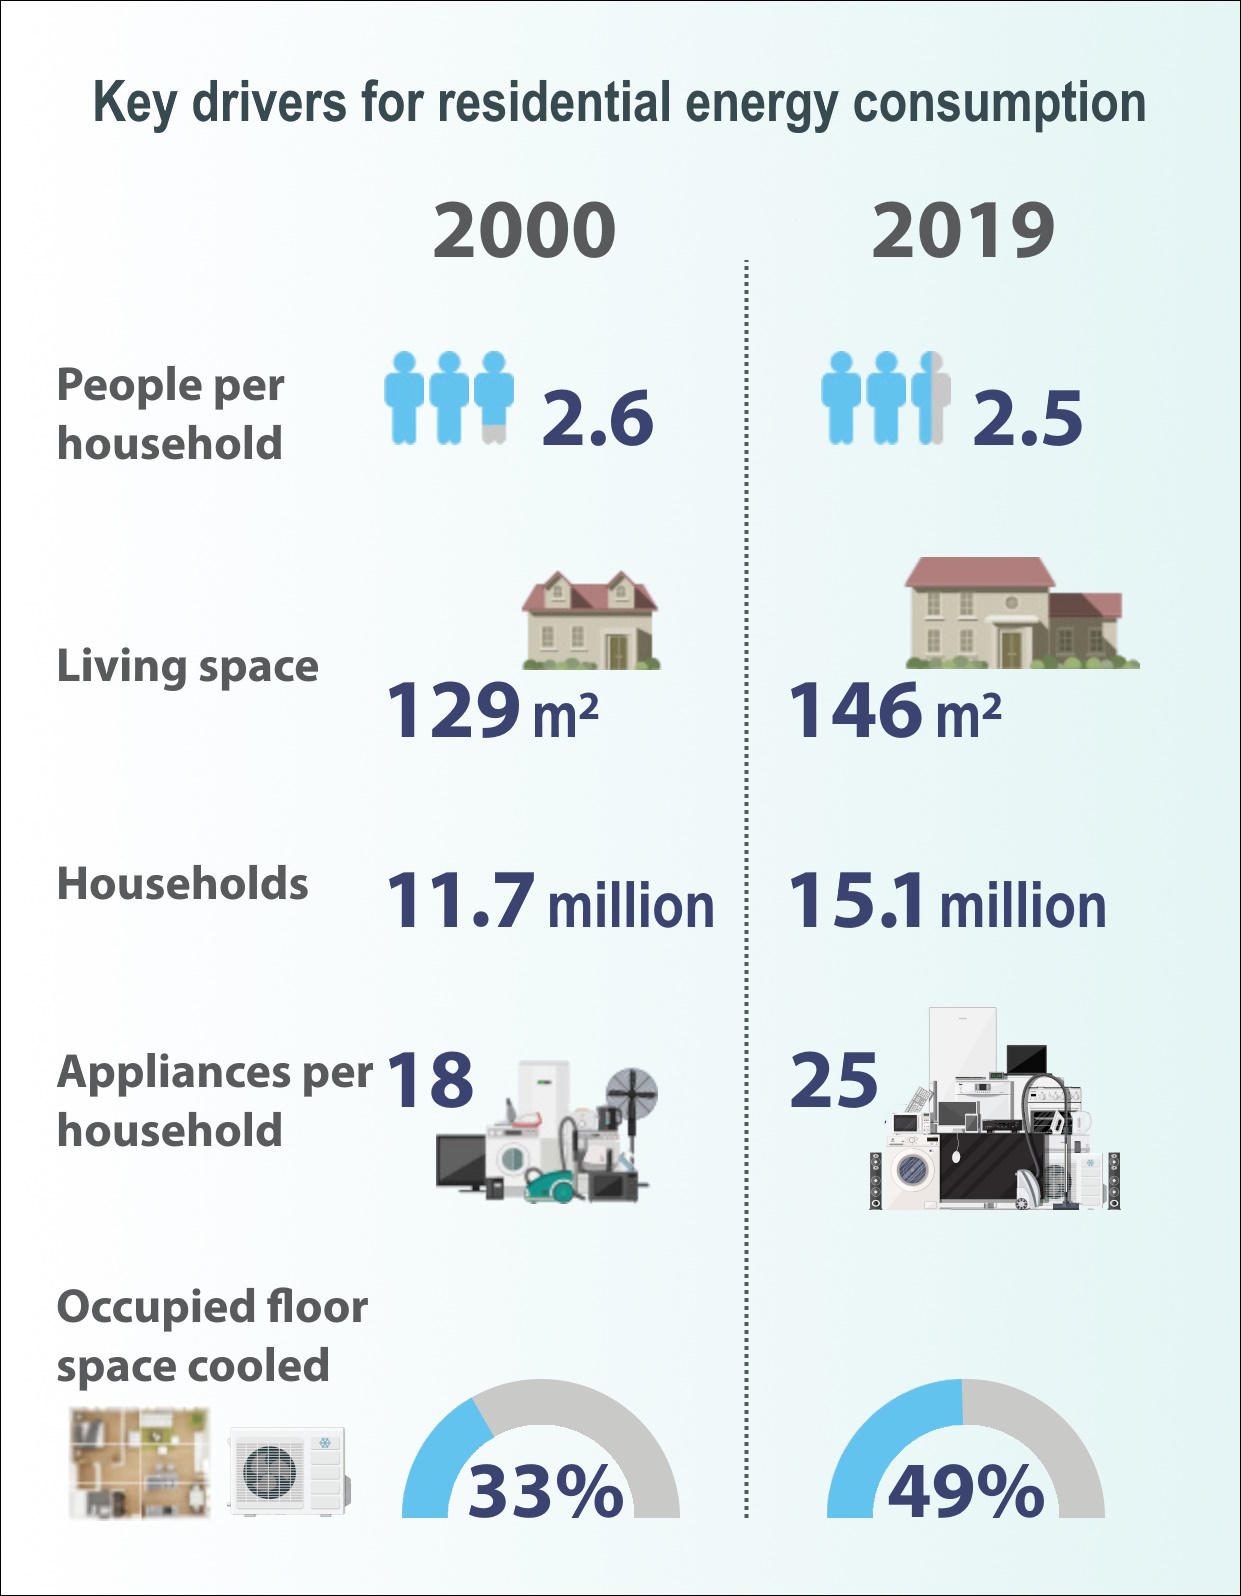
Key drivers for residential energy consumption
Text version
Key drivers for residential energy consumption
| 2000 | 2019 | |
|---|---|---|
| Household Numbers (million) | 11.7 | 15.1 |
| Living space per household (m2) | 129 | 146 |
| People per household | 2.6 | 2.5 |
| Appliances per household | 18 | 25 |
| Occupied floor space cooled (%) | 33 | 49 |
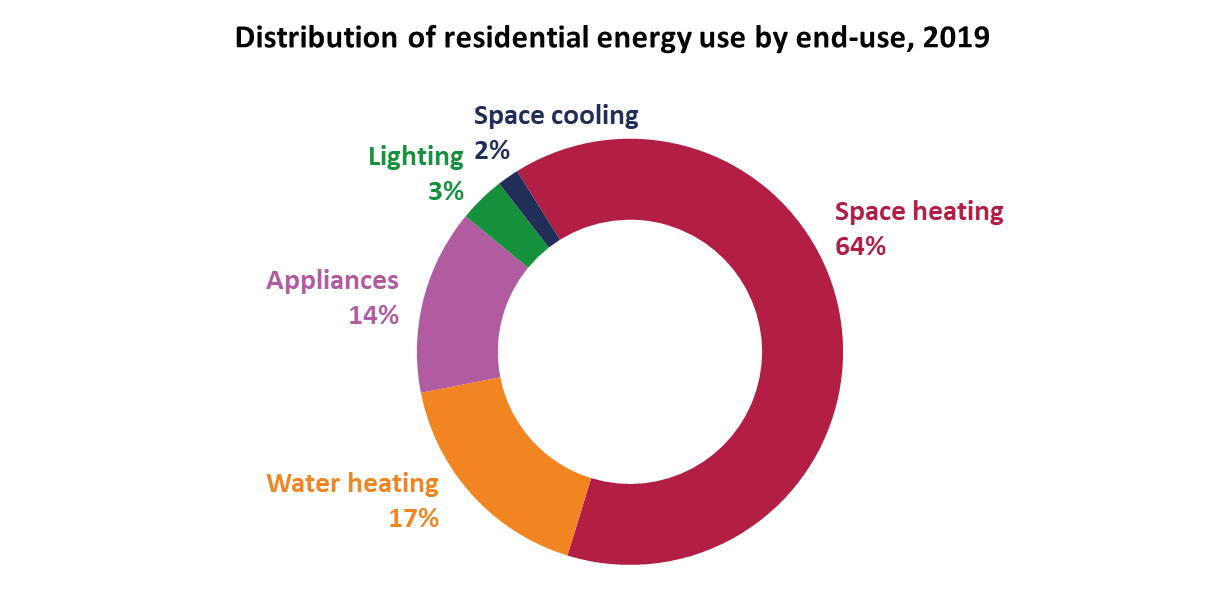
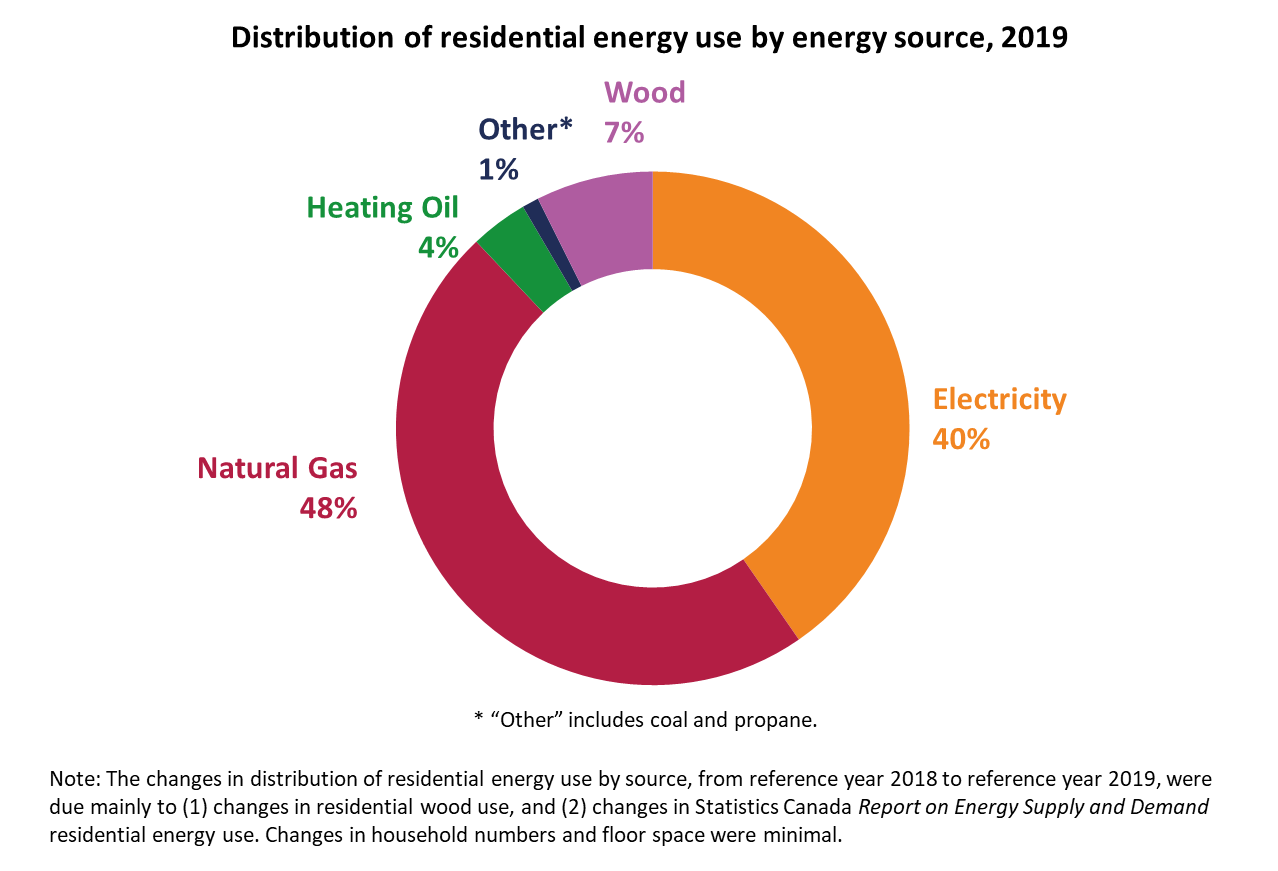
Canadians spent $29.8 billion on energy in their homes in 2019. Most of the energy (81%) was used for space and water heating. Predominant fuels were natural gas, electricity, and home heating oil. Other fuels included wood and propane.
Text version
Distribution of residential energy use by end use, 2019
| Residential energy use | Percentage |
|---|---|
| Space heating | 64 |
| Water heating | 17 |
| Appliances | 14 |
| Lighting | 4 |
| Space cooling | 2 |
Text version
Distribution of residential energy use by energy source, 2019
| Energy source | Percentage |
|---|---|
| Natural gas | 48 |
| Electricity | 40 |
| Wood | 7 |
| Heating oil | 4 |
| OtherFootnote * | 1 |
Text version
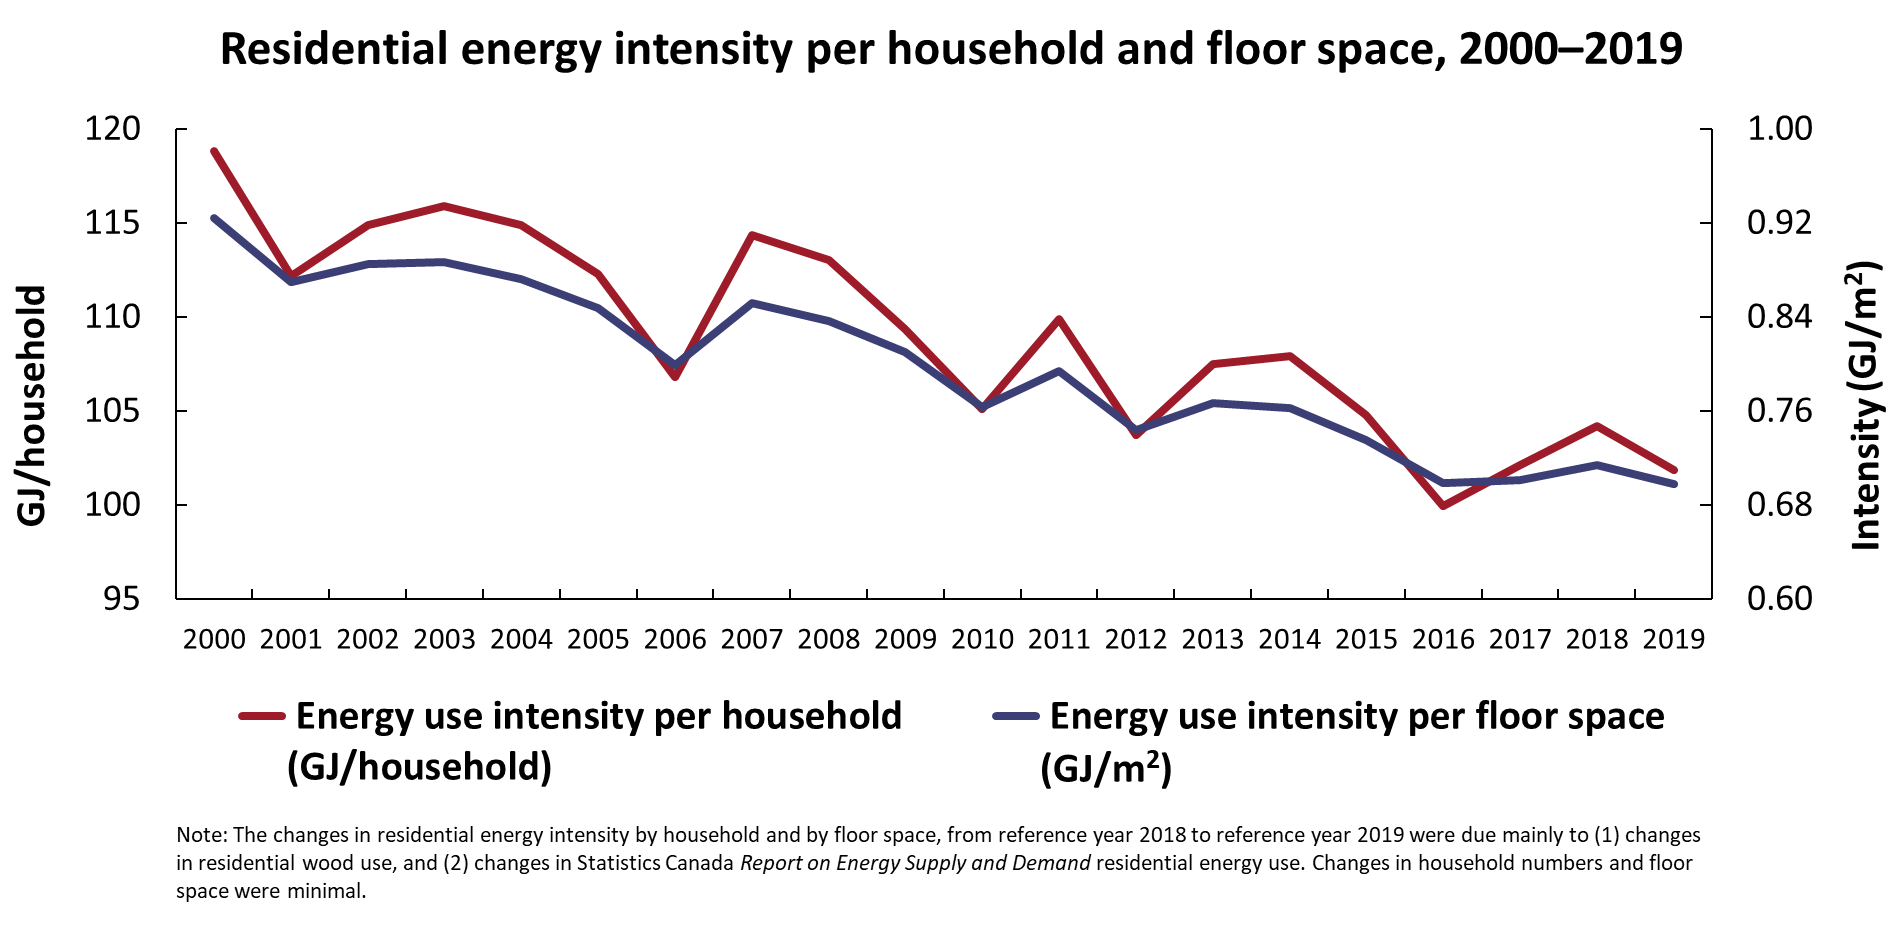
Residential energy intensity per household and floor space, 2000–2019
| Energy intensity per household (GJ/household) | Energy intensity per floor space (GJ/m2) | |
|---|---|---|
| 2000 | 119 | 0.92 |
| 2001 | 112 | 0.87 |
| 2002 | 115 | 0.89 |
| 2003 | 116 | 0.89 |
| 2004 | 115 | 0.87 |
| 2005 | 112 | 0.85 |
| 2006 | 107 | 0.80 |
| 2007 | 114 | 0.85 |
| 2008 | 113 | 0.84 |
| 2009 | 109 | 0.81 |
| 2010 | 105 | 0.76 |
| 2011 | 110 | 0.79 |
| 2012 | 104 | 0.74 |
| 2013 | 107 | 0.77 |
| 2014 | 108 | 0.76 |
| 2015 | 105 | 0.74 |
| 2016 | 100 | 0.70 |
| 2017 | 102 | 0.70 |
| 2018 | 104 | 0.71 |
| 2019 | 102 | 0.70 |
Energy use per household and per unit of floor space has decreased significantly, which was driven by energy efficiency improvements across various residential energy end uses and energy sources.
 Energy efficiency
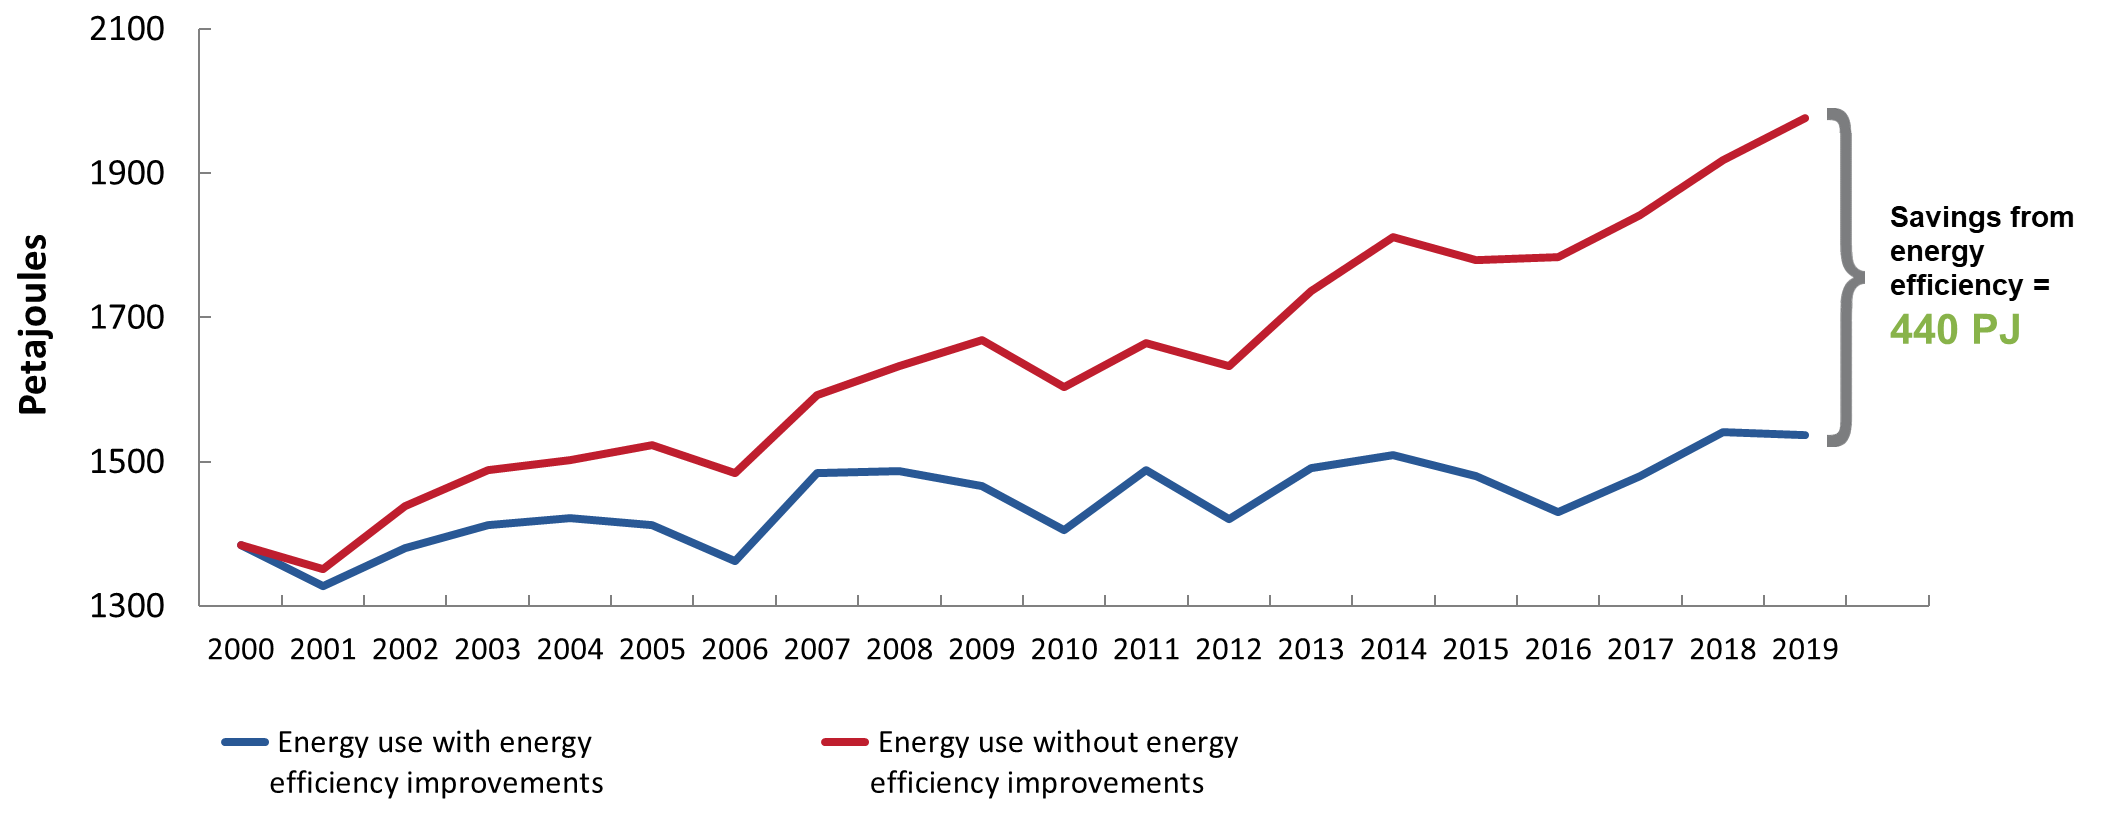
Without energy efficiency gains, energy use would have increased 42.7% instead of 11.0%.
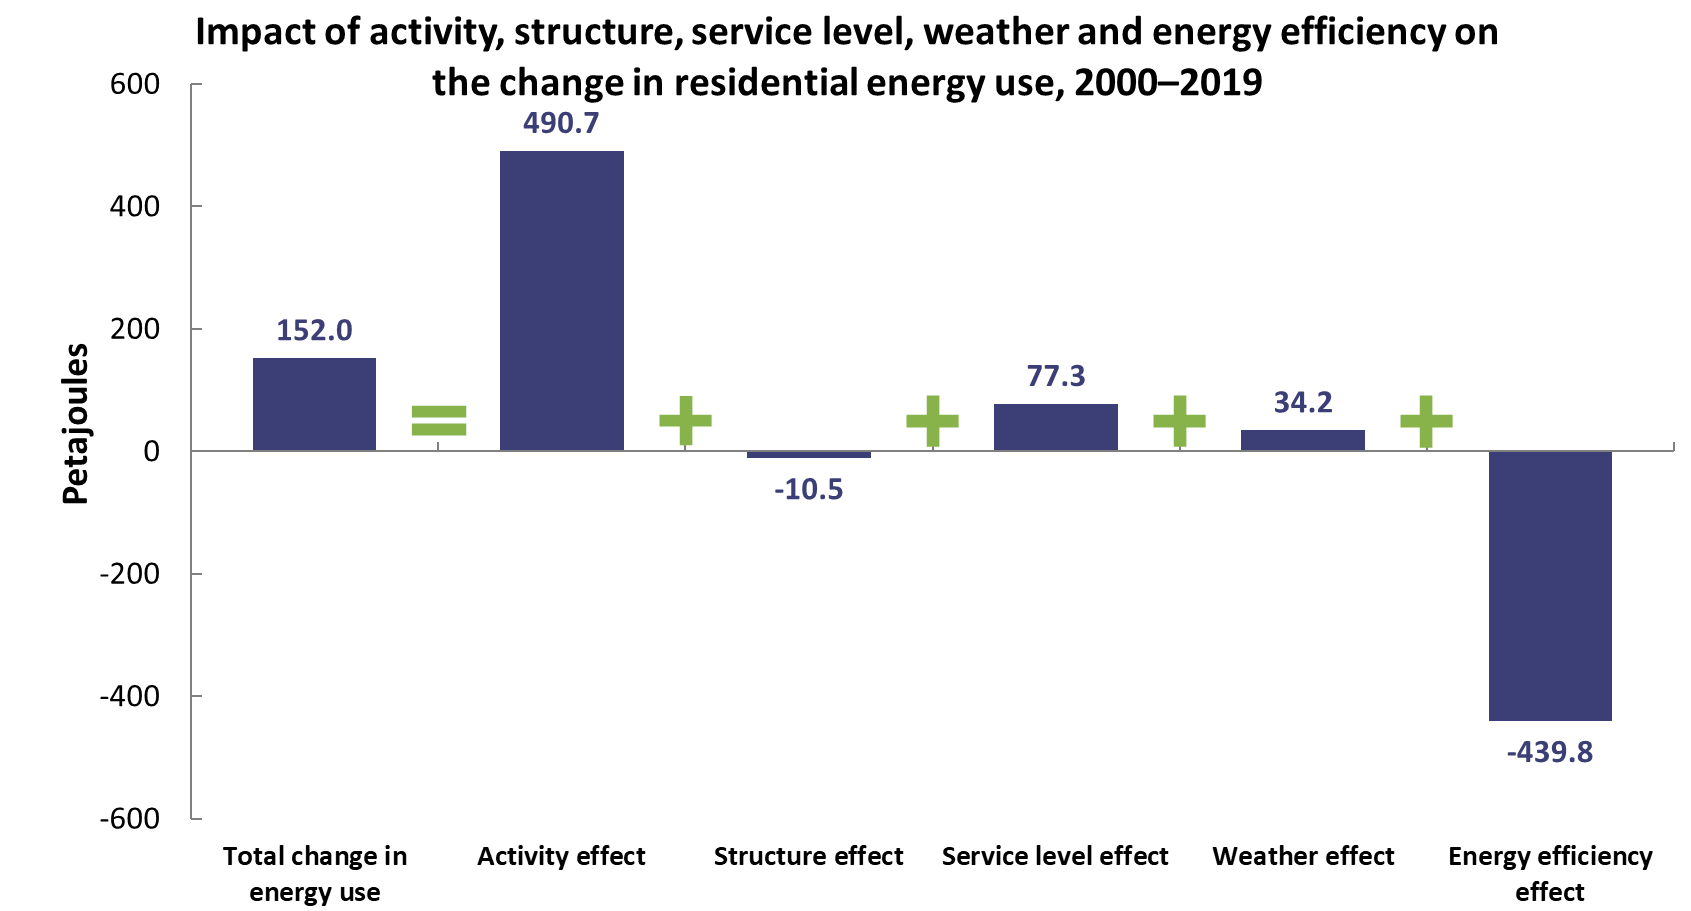
Energy efficiency improvement is measured by estimating the difference between the change in residential energy use and the impacts of the residential sector’s growth, changes in the composite of houses by type (structure effect), the rising number of appliances and electronics, the weather, and other factors.
Text version
Impact of activity, structure, service level, weather and energy efficiency on the change in residential energy use, 2000–2019
| Petajoules | |
|---|---|
| Total change in energy use | 152.0 |
| Activity effect | 490.7 |
| Structure effect | -10.5 |
| Service level effect | 77.3 |
| Weather effect | 34.2 |
| Energy efficiency effect | -439.8 |
- Activity effect – A 30% increase in the number of Canadian households and a 14% increase in the average floor space resulted in an increase of 490.7 PJ in energy use and 20.2 Mt in GHG emissions.
- Structure effect – The structural change for the residential sector reflects mainly changes in the composite of different house types. For the 2000–2019 period, the share of single attached houses in Canada increased 1.6 percentage points, while the shares for other house types decreased. This structural change resulted in a decrease of 10.5 PJ in energy and 0.4 Mt in GHG emissions.
- Service level effect – An increase in appliances, including electronics (e.g. home computers, video consoles and home entertainment systems) resulted in an increase of 77.3 PJ in energy and 3.2 Mt in GHG emissions.
- Weather effect – In 2019, the winter was among the coldest in 20 years and the summer was much hotter than in 2000. As a result, the weather conditions resulted in an increase of 34.2 PJ in energy use and 1.4 Mt in GHG emissions.
- Energy efficiency effect – The 32% improvement in energy efficiency saved 439.8 PJ in energy use, $8.5 billion in energy costs and avoided 18.1 Mt of GHG emissions.
The energy efficiency savings of 440 PJ offset nearly 90% of the impact of higher levels of activity and service.
Residential energy use, with and without energy efficiency improvements, 2000–2019
Text version
Residential energy use, with and without energy efficiency improvements, 2000–2019
| Energy use with energy efficiency improvements | Energy use without energy efficiency improvements | |
|---|---|---|
| 2000 | 1,384 | 1,384 |
| 2001 | 1,328 | 1,351 |
| 2002 | 1,380 | 1,438 |
| 2003 | 1,412 | 1,488 |
| 2004 | 1,422 | 1,503 |
| 2005 | 1,413 | 1,523 |
| 2006 | 1,362 | 1,485 |
| 2007 | 1,485 | 1,593 |
| 2008 | 1,488 | 1,633 |
| 2009 | 1,467 | 1,669 |
| 2010 | 1,406 | 1,603 |
| 2011 | 1,489 | 1,664 |
| 2012 | 1,421 | 1,633 |
| 2013 | 1,492 | 1,737 |
| 2014 | 1,510 | 1,812 |
| 2015 | 1,481 | 1,780 |
| 2016 | 1,430 | 1,784 |
| 2017 | 1,480 | 1,842 |
| 2018 | 1,541 | 1,919 |
| 2019 | 1,536 | 1,976 |
 Space heating
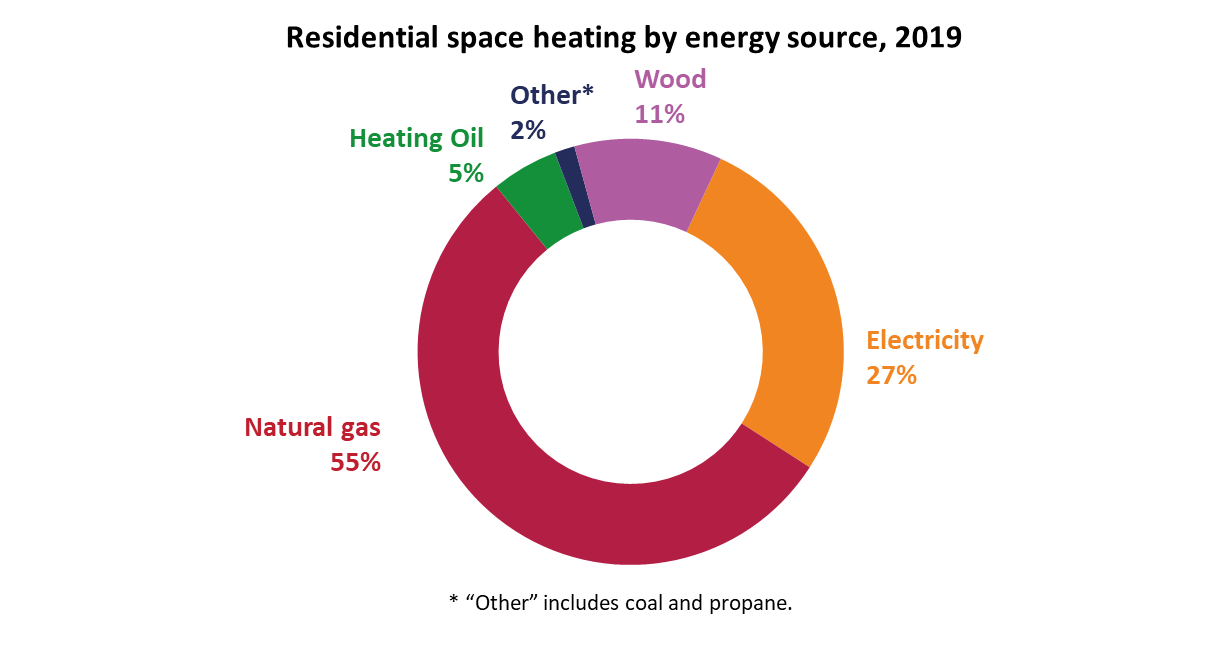
Canadians used the most energy for space heating, accounting for 64% of the total residential energy use, and over half (55%) of the total energy use for space heating was natural gas. The greater penetration of high-efficiency natural gas furnaces (34.1% of all heating systems in 2019 versus 8.8% in 2000) contributed significantly to the sector’s large energy efficiency improvement.
- Installing weather-stripped doors and double-glazed windows
- Keeping insulated basements, walls, ceilings and attics
- Using programmable thermostats
- Stringent building code for new construction
Text version
Residential space heating by energy source, 2019
| Fuel type | Percentage |
|---|---|
| Natural gas | 55 |
| Electricity | 27 |
| Wood | 11 |
| Heating oil | 5 |
| OtherFootnote * | 2 |
Text version
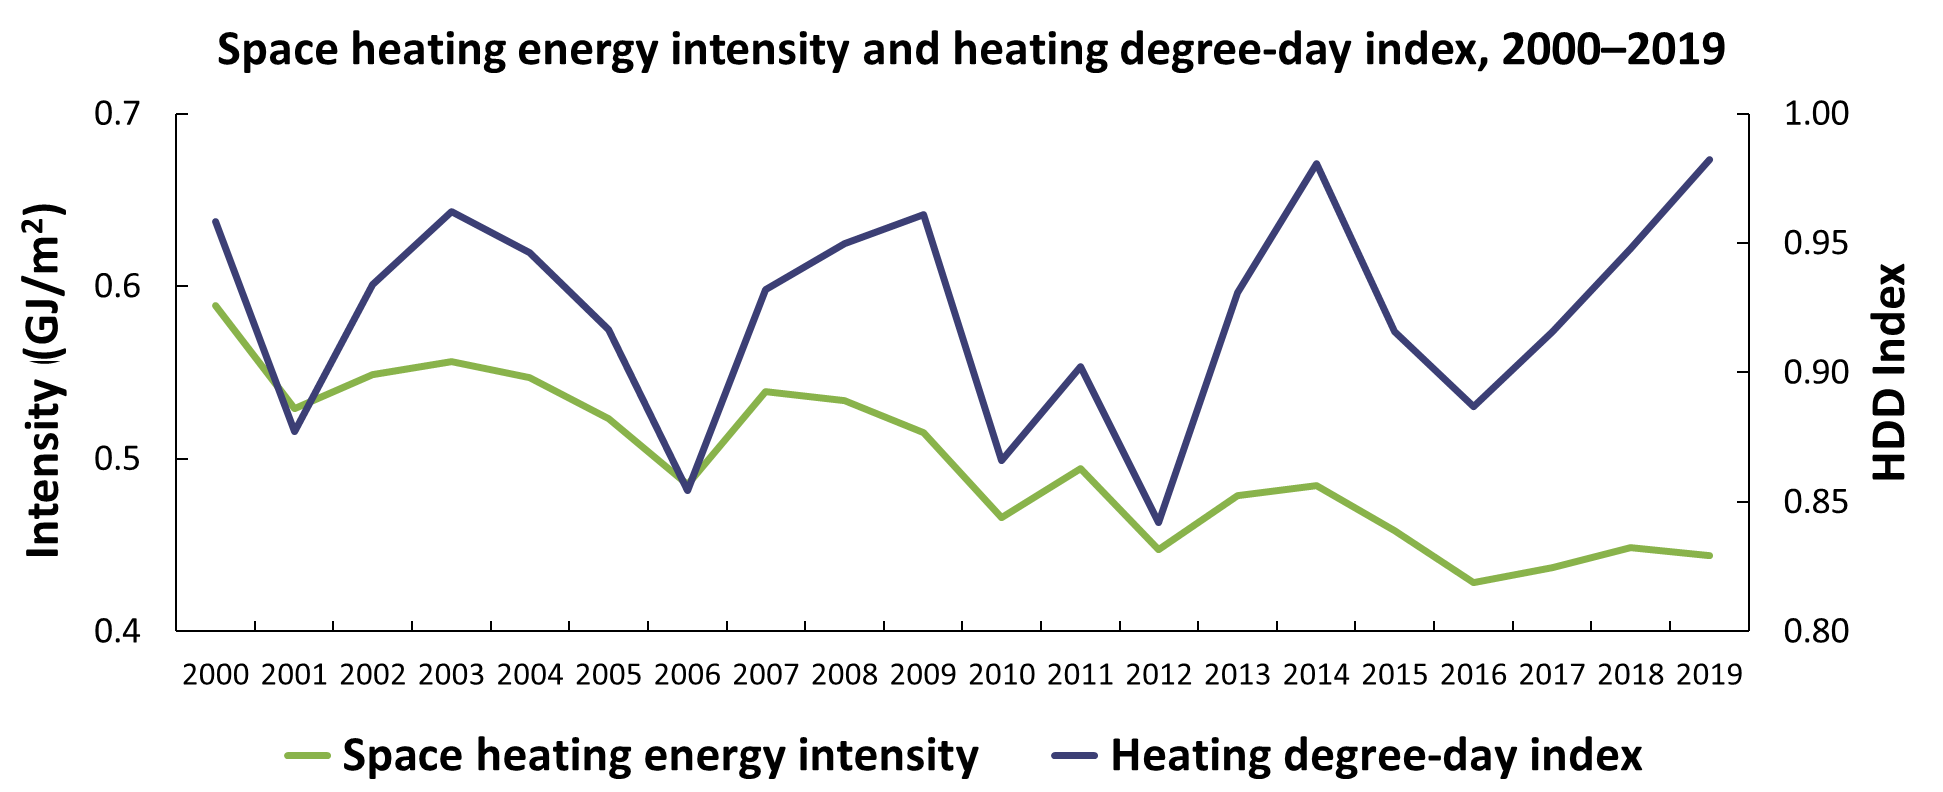
Space heating energy intensity and heating degree-day index, 2000–2019
| Space heating energy intensity | Heating degree-day index | |
|---|---|---|
| 2000 | 0.59 | 0.96 |
| 2001 | 0.53 | 0.88 |
| 2002 | 0.55 | 0.93 |
| 2003 | 0.56 | 0.96 |
| 2004 | 0.55 | 0.95 |
| 2005 | 0.52 | 0.92 |
| 2006 | 0.48 | 0.85 |
| 2007 | 0.54 | 0.93 |
| 2008 | 0.53 | 0.95 |
| 2009 | 0.52 | 0.96 |
| 2010 | 0.47 | 0.87 |
| 2011 | 0.49 | 0.90 |
| 2012 | 0.45 | 0.84 |
| 2013 | 0.48 | 0.93 |
| 2014 | 0.48 | 0.98 |
| 2015 | 0.46 | 0.92 |
| 2016 | 0.43 | 0.89 |
| 2017 | 0.44 | 0.92 |
| 2018 | 0.45 | 0.95 |
| 2019 | 0.44 | 0.98 |
 Water heating
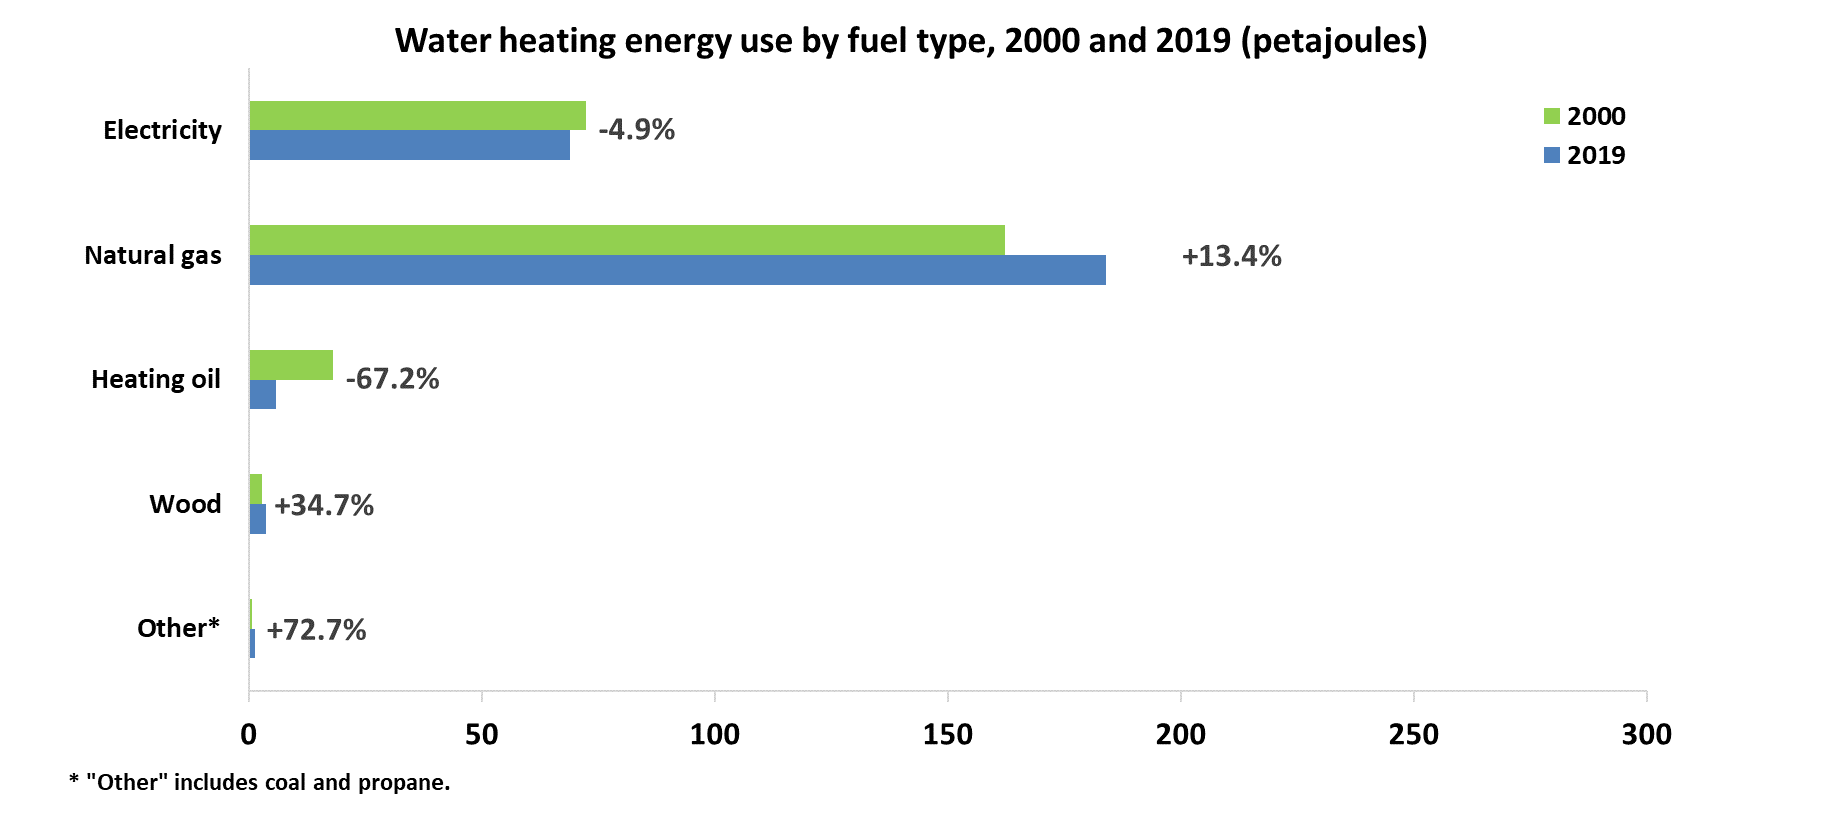
Water heating was the second largest residential energy end use. A shift from oil-fired water heaters to more efficient natural gas heaters and more stringent energy standards for water heaters helped to lower energy use per household. Canadians have also altered energy consumption in water heating by switching to efficient practices such as:
- Switching to tankless water heaters
- Installing low-flow fixtures on showerheads and faucets
- Using dishwashers and clothes washers in full loads
- Using cold water
Text version
Water heating energy use by fuel type, 2000 and 2019 (petajoules)
| 2000 | 2019 | Growth/decrease | |
|---|---|---|---|
| Electricity | 72.5 | 68.9 | -4.9% |
| Natural gas | 162.3 | 184.0 | 21.8% |
| Heating oil | 18.2 | 6.0 | -67.2% |
| Wood | 2.8 | 3.8 | 34.7% |
| OtherFootnote * | 0.7 | 1.3 | 72.7% |
Energy use for residential water heating increased from 256.5 PJ in 2000 to 263.9 PJ in 2019, due to rising households numbers.
 Appliances
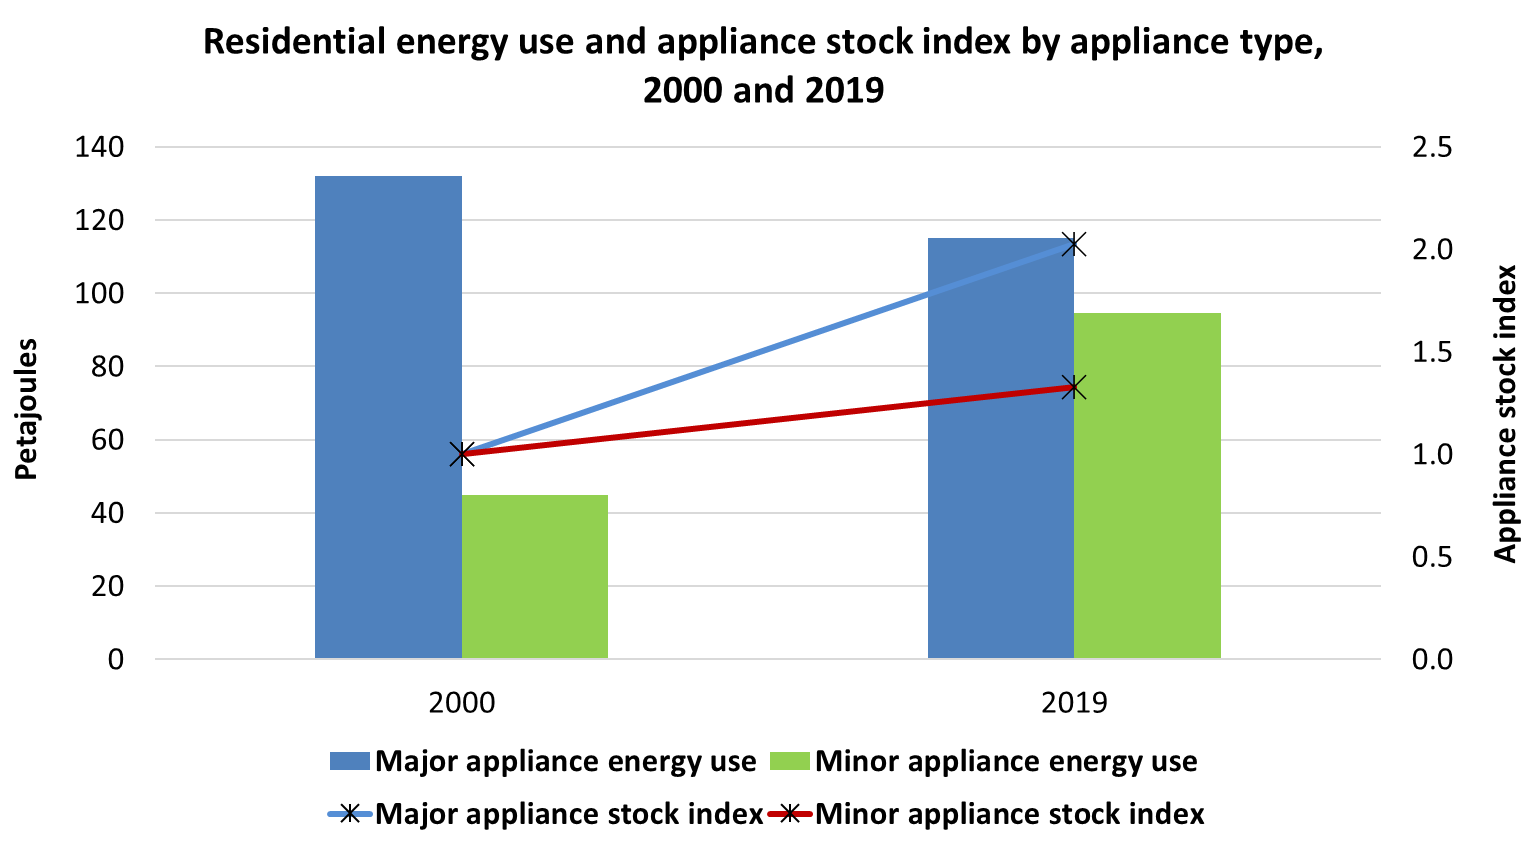
The introduction of minimum energy performance standards under the Energy Efficiency Act has contributed significantly to the dramatic energy efficiency improvement of major appliances and electronics used in the home.
Energy efficiency improvement has been observed for all appliances. However, energy savings from major appliances were more than offset by rising energy use from minor appliances, such as electronics.
Text version
Residential energy use and appliance stock index by appliance type, 2000 and 2019
| 2000 | 2019 | |
|---|---|---|
| Major appliance energy use (petajoules) | 132 | 115 |
| Minor appliance energy use (petajoules) | 45 | 95 |
| Major appliance stock index | 1.00 | 2.03 |
| Minor appliance stock index | 1.00 | 1.33 |
Text version
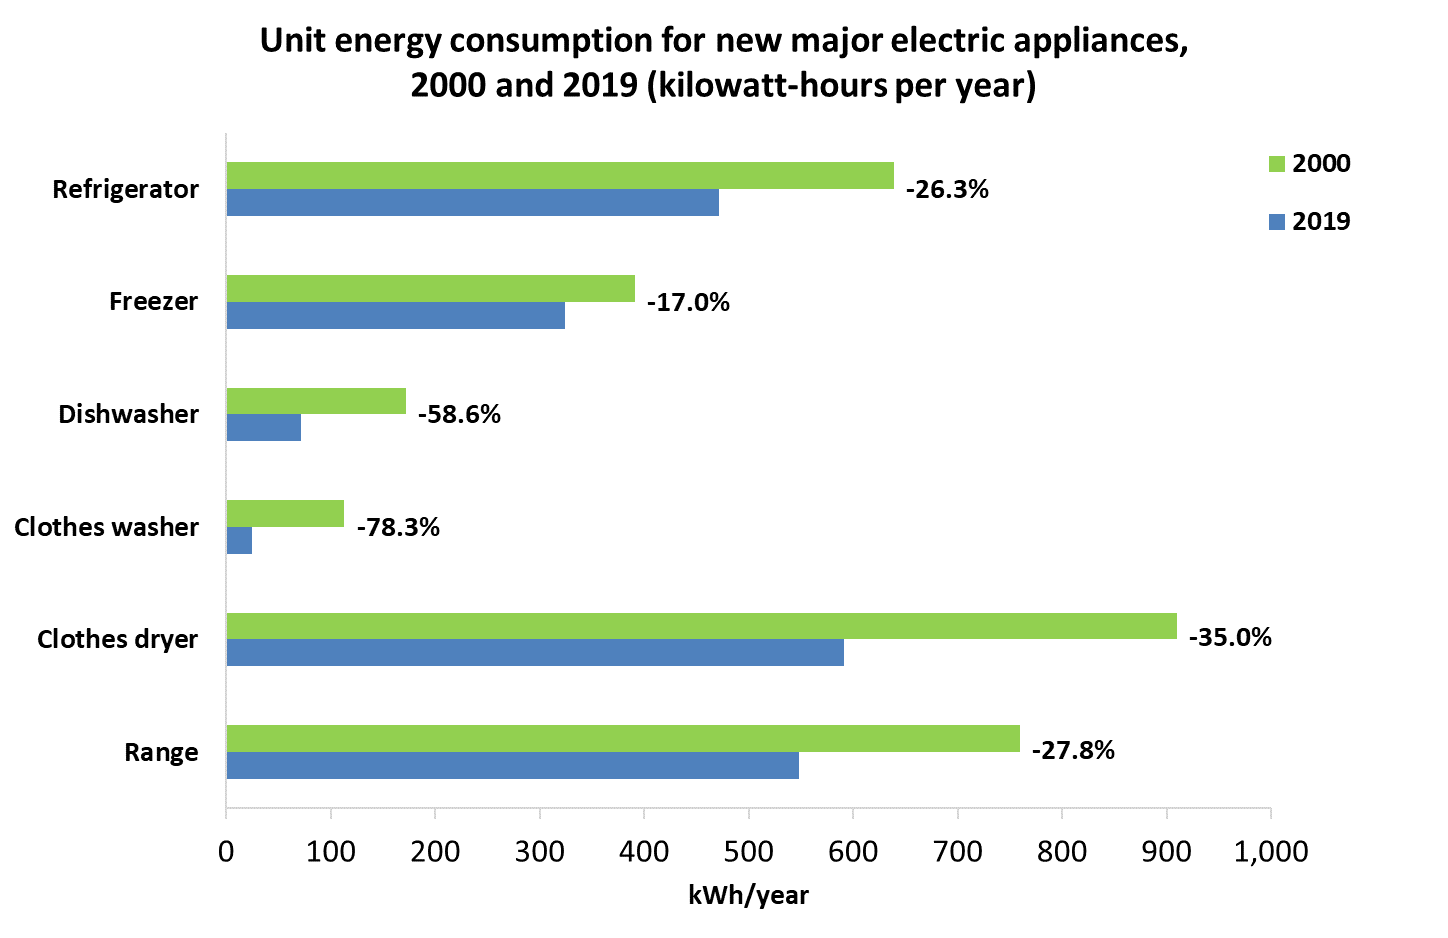
Unit energy consumption of new major electric appliances, 2000 and 2019 (kilowatt-hours per year)
| 2000 | 2019 | Growth/decrease | |
|---|---|---|---|
| Refrigerator | 640 | 471 | -26.3% |
| Freezer | 391 | 324 | -17.0% |
| Dishwasher | 172 | 71 | -58.6% |
| Clothes washer | 113 | 25 | -78.3% |
| Clothes dryer | 910 | 591 | -35.0% |
| Range | 760 | 548 | -27.8% |
A dishwasher purchased in 2019 was nearly 60% more energy-efficient than one manufactured in 2000. A clothes washer purchased in 2019 required less than one quarter of the energy needed for one manufactured in 2000. While the number of major appliances used in households increased 33%, energy consumption decreased 18%.
The energy used to power smaller appliances, such as televisions, computers and mobile phones more than doubled in the past 20 years, as the effect of lower energy use per unit only partially offset that of rising numbers of minor appliances.
For the 2000 – 2019 period, the number of mobile phones used in Canada is estimated to have almost quadrupled from 8.7 million to 34.4 million. For the same period, the number of households with internet access more than doubled, from 6 million to 13.4 million.
The 58 PJ increase in minor appliances energy use was partially offset by the 18 PJ decrease in major appliances energy use.
 Space cooling
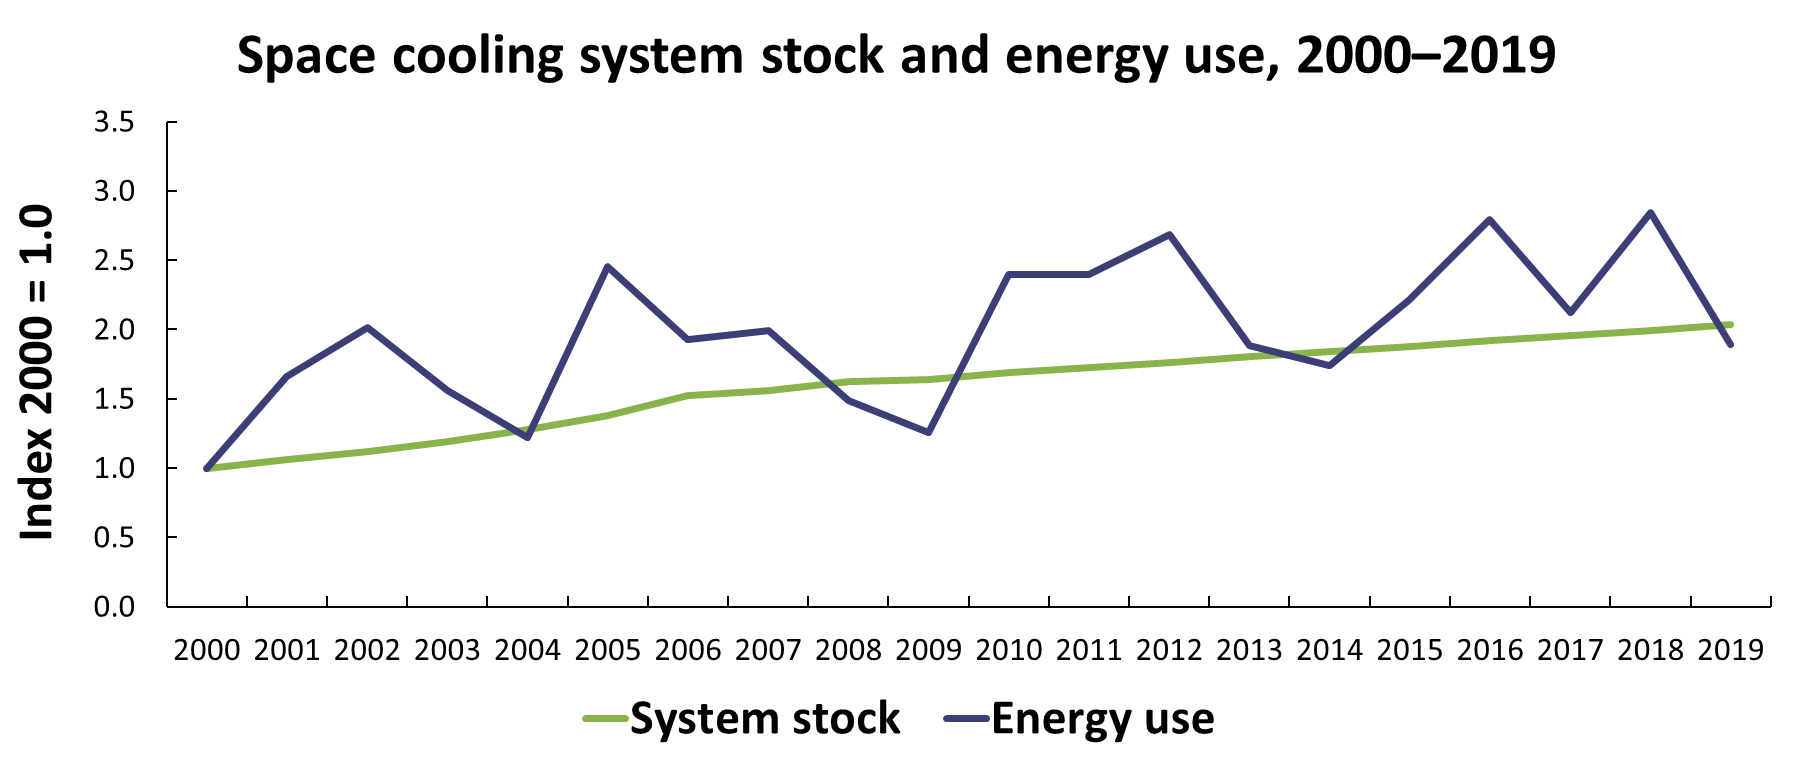
Between 2000 and 2019, the energy used to cool homes increased from 13 PJ to 25 PJ. This increase would have been higher without more efficient room and central air conditioners.
Text version
Space cooling system stock and energy use, 2000–2019
| System stock | Energy use | |
|---|---|---|
| 2000 | 1.00 | 1.00 |
| 2001 | 1.06 | 1.66 |
| 2002 | 1.12 | 2.02 |
| 2003 | 1.19 | 1.56 |
| 2004 | 1.28 | 1.22 |
| 2005 | 1.38 | 2.45 |
| 2006 | 1.52 | 1.92 |
| 2007 | 1.56 | 1.99 |
| 2008 | 1.63 | 1.49 |
| 2009 | 1.64 | 1.25 |
| 2010 | 1.69 | 2.39 |
| 2011 | 1.73 | 2.39 |
| 2012 | 1.76 | 2.68 |
| 2013 | 1.80 | 1.88 |
| 2014 | 1.84 | 1.74 |
| 2015 | 1.88 | 2.21 |
| 2016 | 1.92 | 2.79 |
| 2017 | 1.95 | 2.12 |
| 2018 | 1.99 | 2.85 |
| 2019 | 2.03 | 1.89 |
Along with the increase in the number and size of households, more Canadians have air conditioners at home, increasing energy use for cooling significantly. Meanwhile, cooling energy use was very volatile because of drastic changes in weather conditions. However, the following actions by Canadians helped offset some of the energy consumption:
- Using ENERGY STAR ™ certified room or central air conditioners
- Using programmable thermostats
In 2019, compared to 2000, the stock of room and central air conditioners was 41% and 32% more efficient, respectively.
 Lighting
The increased use of energy-saving light bulbs, such as LEDs (light-emitting diodes), led to a decrease in lighting energy use per household.
Despite the increase in the number of households between 2000 and 2019, lighting energy use per household decreased 25% from 4.7 GJ to 3.6 GJ per household, because of the following practices:
- Using LED light bulbs
- Using outdoor lights with motion detectors
- Using timers for holiday lights
- Turning off unnecessary lights
- Using task lighting instead of ceiling lights
- Choosing light bulbs with a wattage that matches the purpose of the room/area
- Using multiple switches and light dimmers
Text version
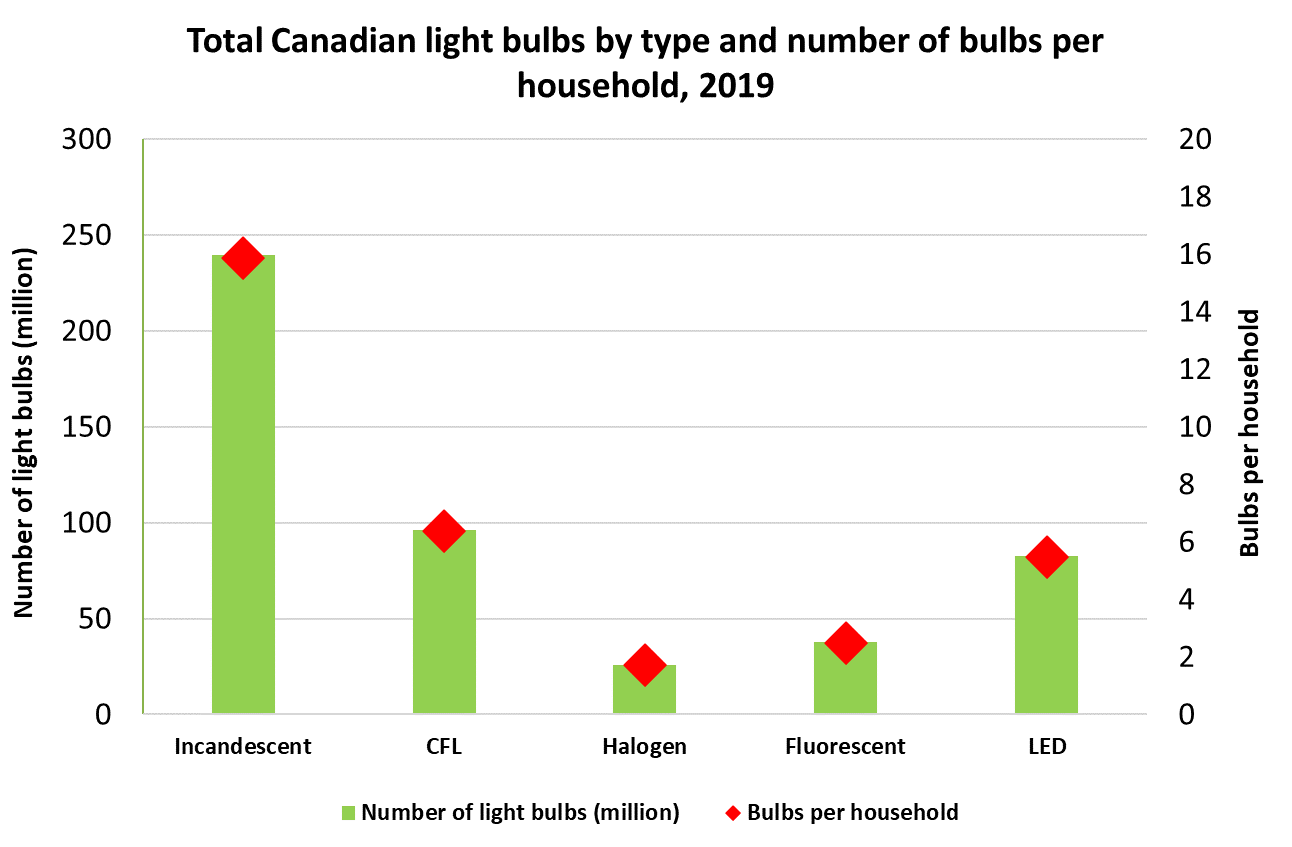
Total Canadian light bulbs by type and number of bulbs per household, 2019
| Number of light bulbs | Bulbs per household | |
|---|---|---|
| Incandescent | 239,386,562 | 15.87 |
| CFL | 96,154,843 | 6.37 |
| Halogen | 26,862,540 | 1.71 |
| Fluorescent | 37,585,467 | 2.49 |
| LED | 82,609,788 | 5.48 |
| Total Stock | 481,599,200 | 31.92 |