Energy Use in the Transportation Sector
![]()
The Office of Energy Efficiency at Natural Resources Canada has changed the base year from 1990 to 2000. This change was made to ensure that our data reflects developments in trends and structures of Canada’s energy end use and efficiency across sectors. It also synchronizes reporting on Canada’s energy use data with changes recently made by the International Energy Agency.
Highlights
- Energy efficiency in the transportation sector improved 23%, saving Canadians 488.6 PJ in energy and $14.2 billion in costs in 2019.
- Transportation energy use increased 26%. More cars and trucks on the roads and greater freight mileage contributed to increased energy use in this sector.
- Energy efficiency improved 21%, saving 263.3 PJ in energy and $7.0 billion in costs in 2019.
- Passenger transportation energy use increased 19%, but it would have increased 40% without energy efficiency improvements.
- Energy efficiency helped avoid 17.8 Mt in GHG emissions in 2019.
- Energy efficiency improved 25%, saving 225.3 PJ in energy and $7.2 billion in costs in 2019.
- Freight transportation energy use increased 34%, but it would have increased 59% without energy efficiency improvements.
- Energy efficiency helped avoid 15.9 Mt in GHG emissions in 2019.
Passenger transportation
Freight transportation
 Overview – Energy use
The sector is diverse and covers several modes of transportation, including road, air, rail and marine. In Canada, these modes of transportation are used for transporting both people and goods.
Canadian individuals and businesses spent $83 billion on fuel for transportation in 2019, which was almost double that of the industrial sector. This is due to significantly higher cost of transportation fuels compared to energy sources used in the industrial and other sectors.
Text version
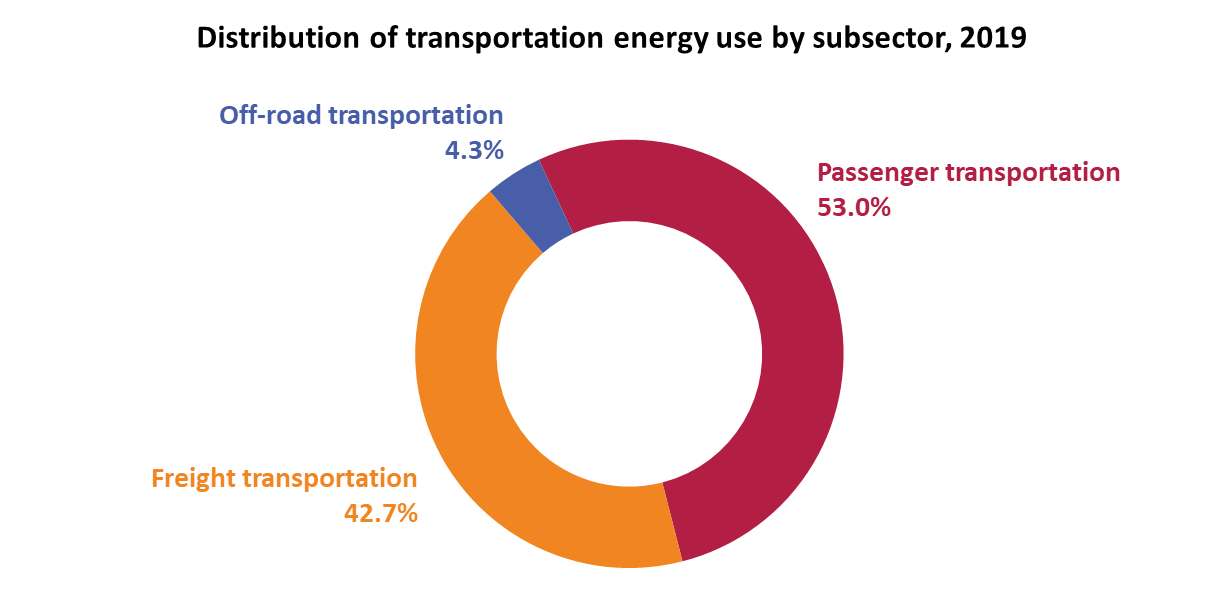
Distribution of transportation energy use by subsector, 2019
| Percentage | |
|---|---|
| Passenger transportation | 53.0 |
| Freight transportation | 42.7 |
| Off-road transportation | 4.3 |
Text version
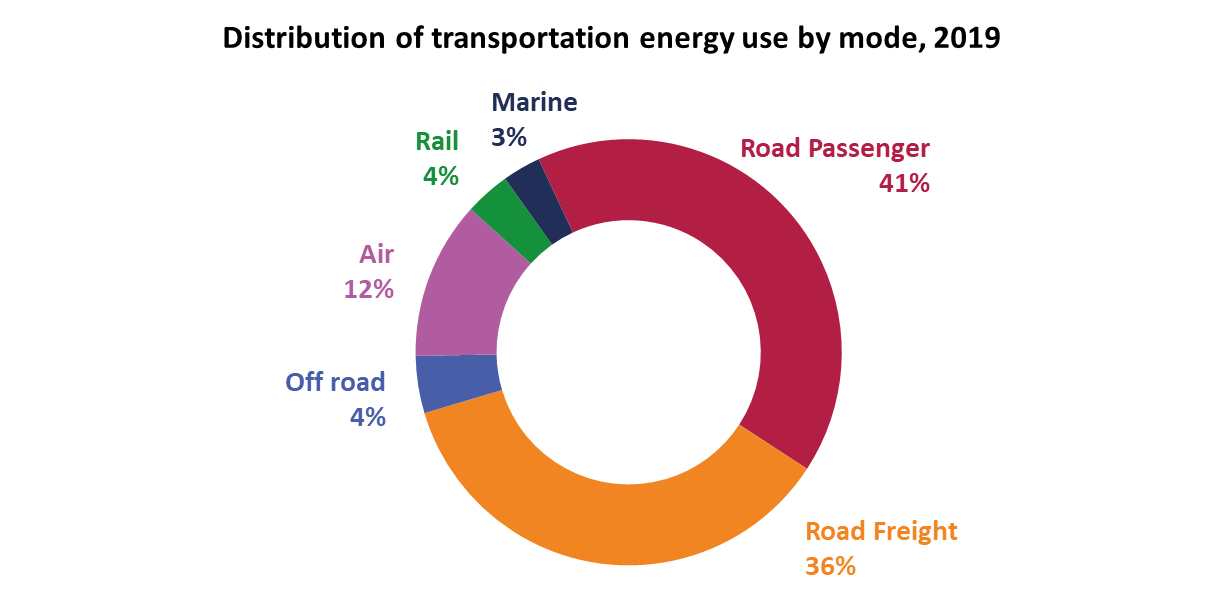
Distribution of transportation energy use by mode, 2019
| Percentage | |
|---|---|
| Road passenger | 41 |
| Road freight | 36 |
| Off road | 4 |
| Air | 12 |
| Rail | 3 |
| Marine | 3 |
 Transportation energy use
Total energy use by the transportation sector increased 26% between 2000 and 2019, from 2,265.9 PJ to 2,855.7 PJ, and associated GHG emissions increased 23%, from 160.1 Mt to 196.9 Mt.
Among the subsectors, freight transportation experienced the most rapid growth, representing 53% of the increase in transportation energy use. This growth is largely driven by just-in-time shipping, and on-line shopping/home delivery. Furthermore, the growing preference to use commercial trucks, which typically consume more energy than other modes of transportation, in itself accounts for 96% of the increase in energy use in the freight subsector and 44% of the increase across all transportation subsectors.
Text version
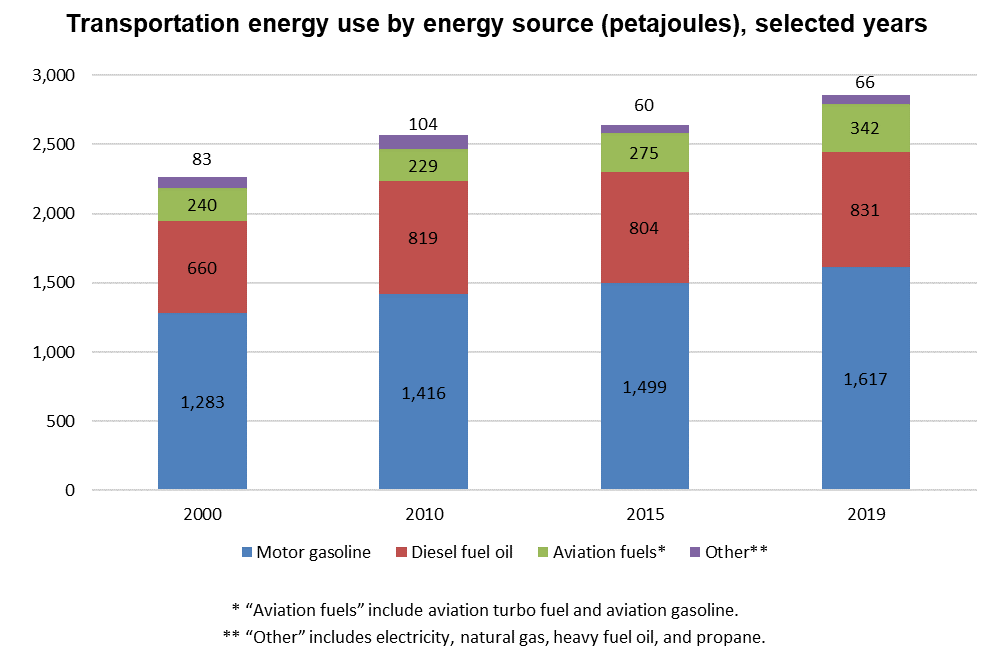
Transportation energy use by energy source (petajoules), selected years
| 2000 | 2010 | 2015 | 2019 | |
|---|---|---|---|---|
| Motor gasoline | 1,283 | 1,416 | 1,499 | 1,617 |
| Diesel fuel oil | 660 | 819 | 804 | 831 |
| Aviation fuelsFootnote * | 240 | 229 | 275 | 342 |
| OtherFootnote ** | 83 | 104 | 60 | 66 |
Diesel consumption increased 26% between 2000 to 2019, which was driven by the increasing use of medium- and heavy-duty vehicles on Canadian roads. Moreover, motor gasoline consumption, including ethanol, increased 26%, with freight transportation vehicles and passenger vehicles accounting for 48% and 40% of that increase, respectively.
Toward the end of the 1970s, the Canadian government proposed voluntary targets for the automotive industry. Performance standards for passenger vehicles improved from 13.1 L/100 km to 8.6 L/100 km between 1978 and 1985, but saw little further change up to 2010, because no strict fuel efficiency standards were in place. Targets for light trucks were introduced in 1990, resulting in a performance improvement from 11.8 L/100 km to 10.0 L/100 km by 2010.
In October 2010, the Government of Canada approved the Passenger Automobile and Light Truck Greenhouse Gas Emission Regulations. The goal of these regulations was to reduce CO2 emissions by 12% to 19%, depending on the light-duty vehicle category.
For 2017–2025 model year passenger vehicles, the GHG emission target value applicable to a given vehicle’s footprint is expected to decrease by 5% on average per year, using the 2016 model year standards as the baseline and applying that rate each year, up to and including the 2025 model year. Most light trucks face greater challenges in terms of GHG emissions than typical passenger vehicles due to their specific features (towing capacity, storage room, additional passenger seat). Consequently, the target values for GHG emissions for 2017–2021 model year light trucks have decreased by a lower annual rate, i.e. 3.5%. In recent years, initiatives and regulations designed to encourage technological progress were introduced for all other transportation modes as well as to increase their energy efficiency and improve their performance.
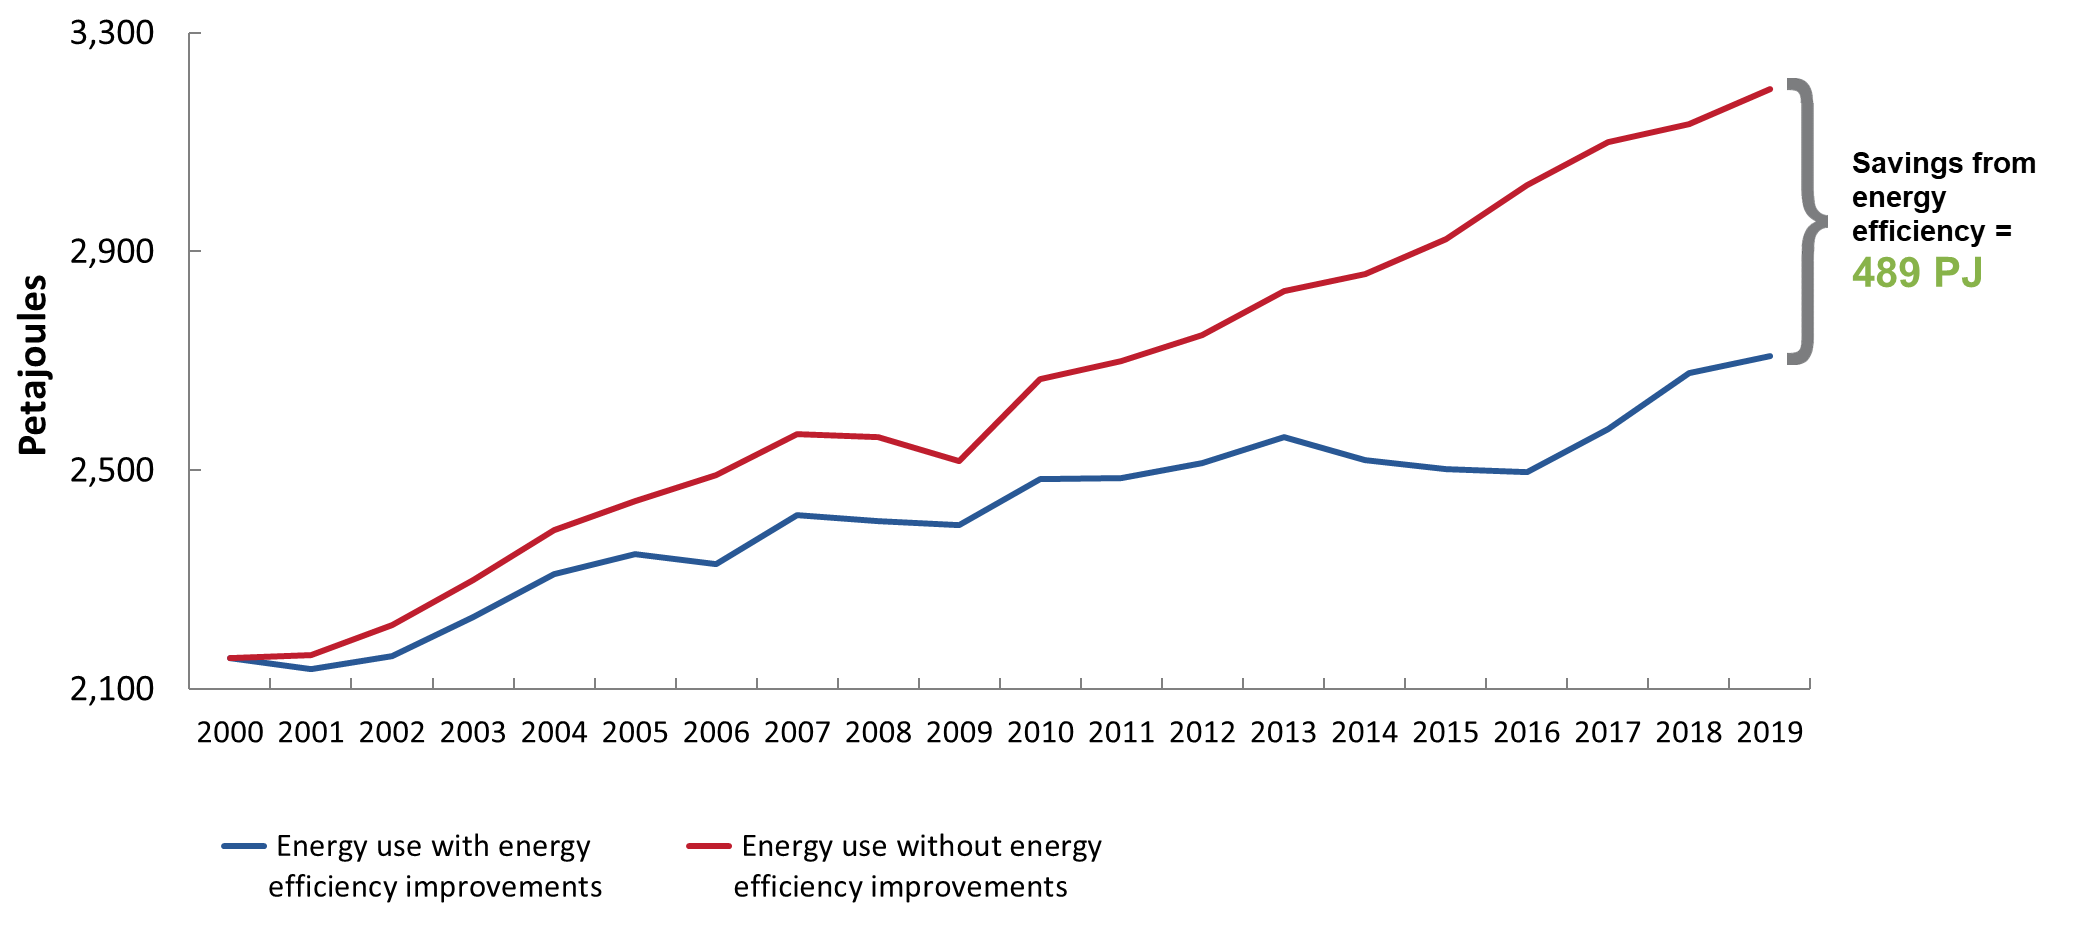
Energy efficiency improvements in the transportation sector resulted in savings of $14.1 billion for Canadians in 2019.
Transportation energy use, with and without energy efficiency improvements, 2000–2019 (petajoules)
Text version
Transportation energy use, with and without energy efficiency improvements, 2000–2019 (petajoules)
| Energy use with energy efficiency improvements | Energy use without energy efficiency improvements | |
|---|---|---|
| 2000 | 2,157 | 2,157 |
| 2001 | 2,136 | 2,163 |
| 2002 | 2,161 | 2,217 |
| 2003 | 2,231 | 2,299 |
| 2004 | 2,311 | 2,392 |
| 2005 | 2,347 | 2,444 |
| 2006 | 2,329 | 2,491 |
| 2007 | 2,419 | 2,566 |
| 2008 | 2,407 | 2,561 |
| 2009 | 2,399 | 2,517 |
| 2010 | 2,484 | 2,667 |
| 2011 | 2,486 | 2,700 |
| 2012 | 2,513 | 2,747 |
| 2013 | 2,561 | 2,828 |
| 2014 | 2,518 | 2,858 |
| 2015 | 2,502 | 2,923 |
| 2016 | 2,498 | 3,021 |
| 2017 | 2,576 | 3,100 |
| 2018 | 2,678 | 3,133 |
| 2019 | 2,709 | 3,197 |
Energy efficiency in the transportation sector improved 23% between 2000 and 2019, resulting in savings of 488.6 PJ in energy in 2019. These savings were driven by energy efficiency improvements in passenger transportation (263.3 PJ) and freight transportation (225.3 PJ).
 Passenger transportation energy use
Text version
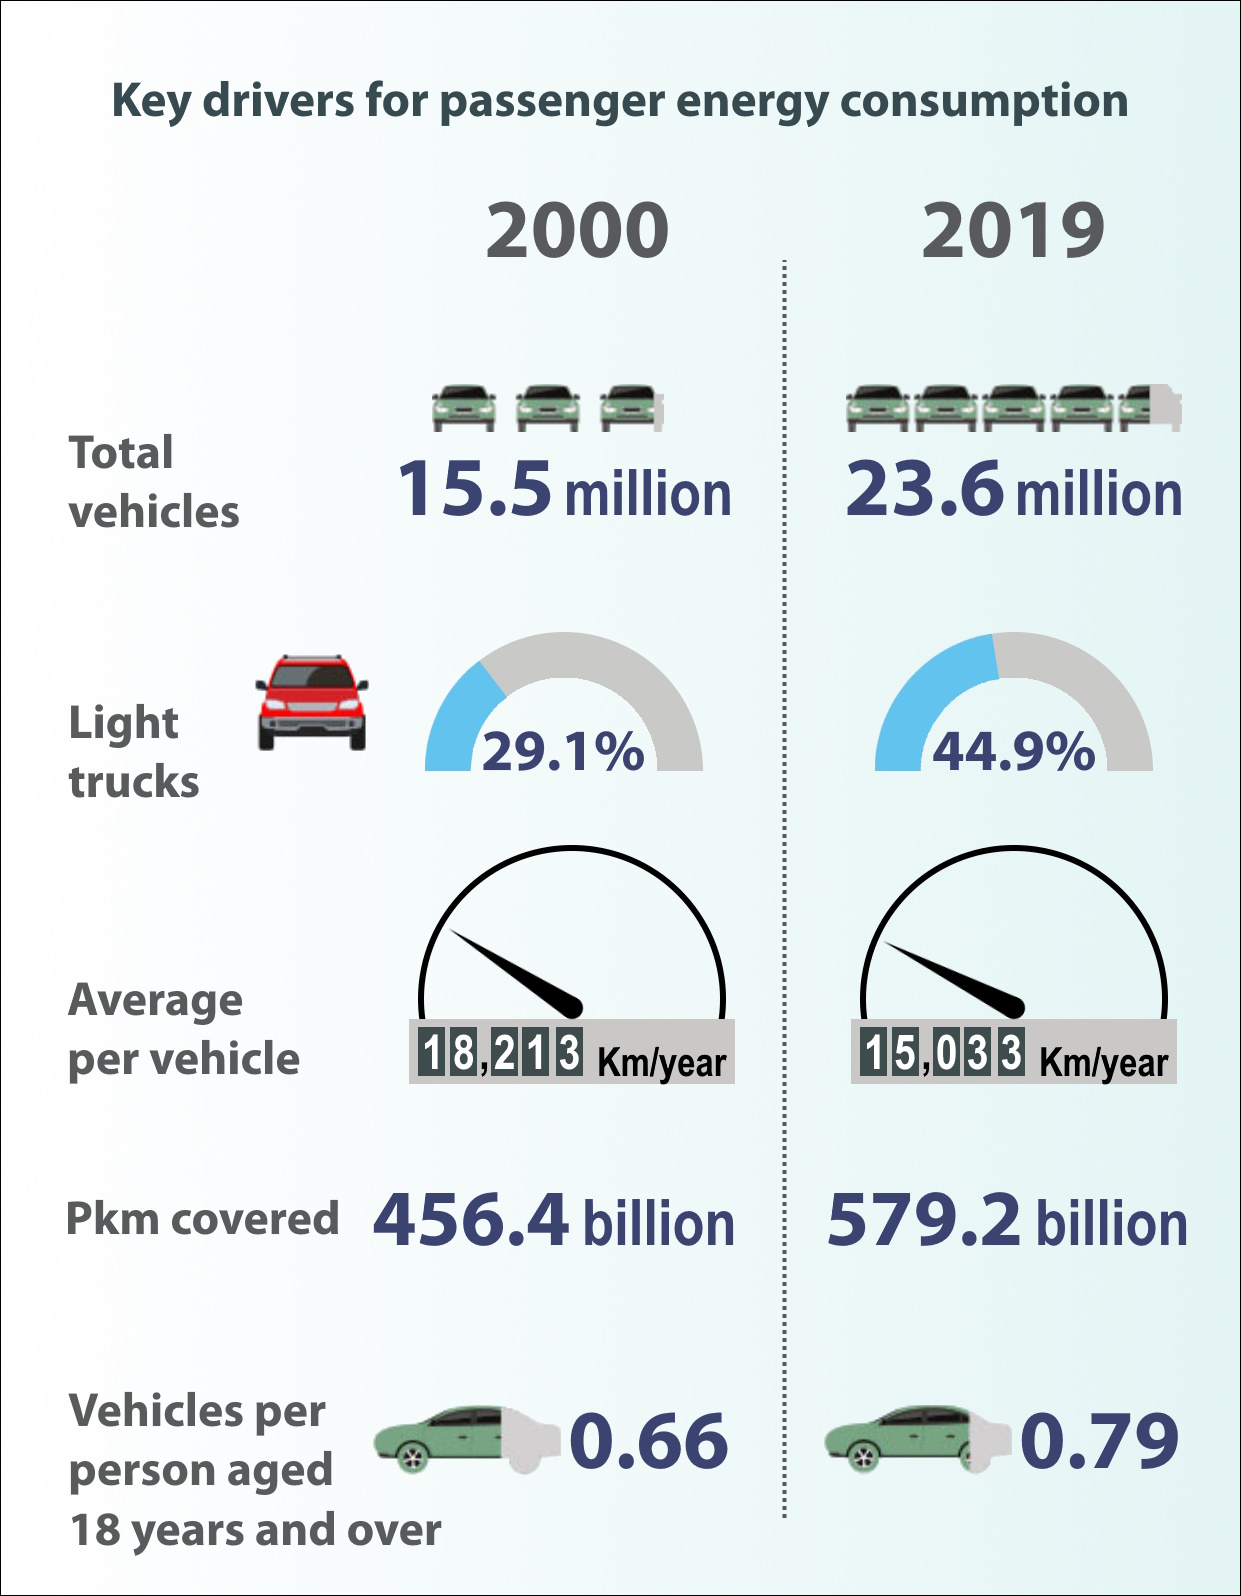
Key drivers for passenger energy use
| 2000 | 2019 | |
|---|---|---|
| Total vehicles (million) | 15.5 | 23.6 |
| Light trucks (%) | 29.1 | 44.9 |
| Average per vehicle (km/year) | 18,213 | 15,033 |
| Pkm covered (billion) | 456.4 | 579.2 |
| Vehicles per person aged 18 years and over | 0.66 | 0.79 |
Text version
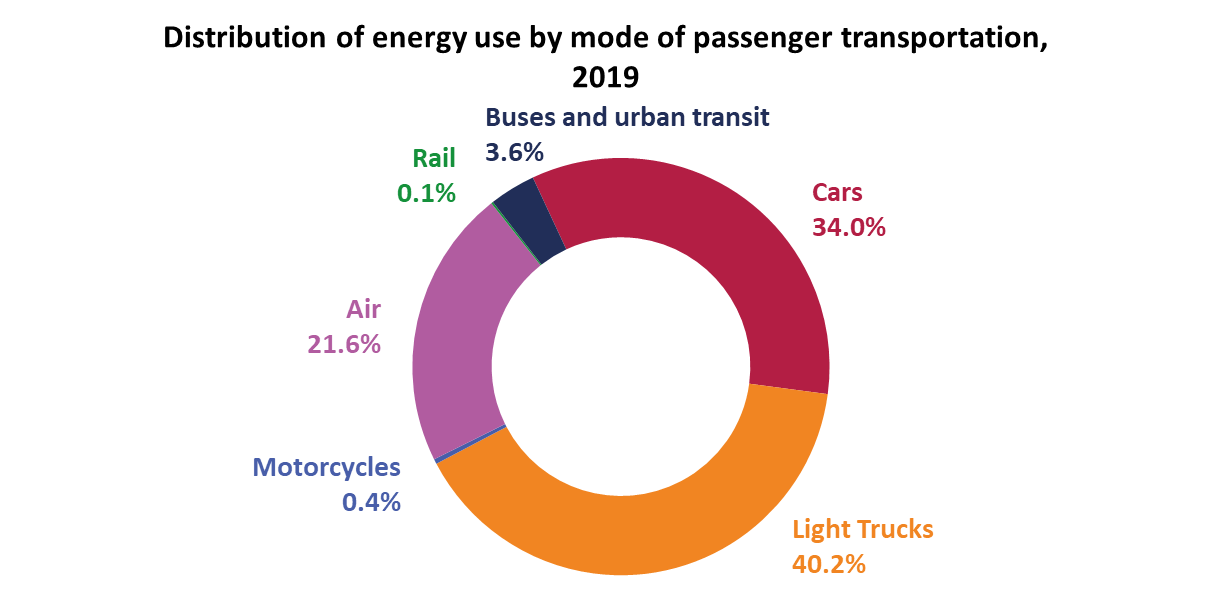
Distribution of energy use by mode of passenger transportation, 2019
| Percentage | |
|---|---|
| Cars | 34.0 |
| Light trucks | 40.2 |
| Motorcycles | 0.4 |
| Air | 21.6 |
| Rail | 0.1 |
| Buses and urban transit | 3.6 |
The number of light-duty vehicles per person aged 18 years and older has increased slightly.
The distance covered in PkmFootnote 3 for light vehicles (excluding urban transportation and coaches) increased on average by 1.4% per year. However, the distance covered in Pkm for urban transportation and coaches increased on average by 1.7% per year between 2000 and 2019.
Consequently, the public transit market share has increased over the past 19 years. Over this period, passenger transportation energy consumption increased 19%, from 1,275.4 PJ to 1,512.2 PJ, and associated GHG emissions increased 14%, from 89.4 Mt to 102.1 Mt.
Text version
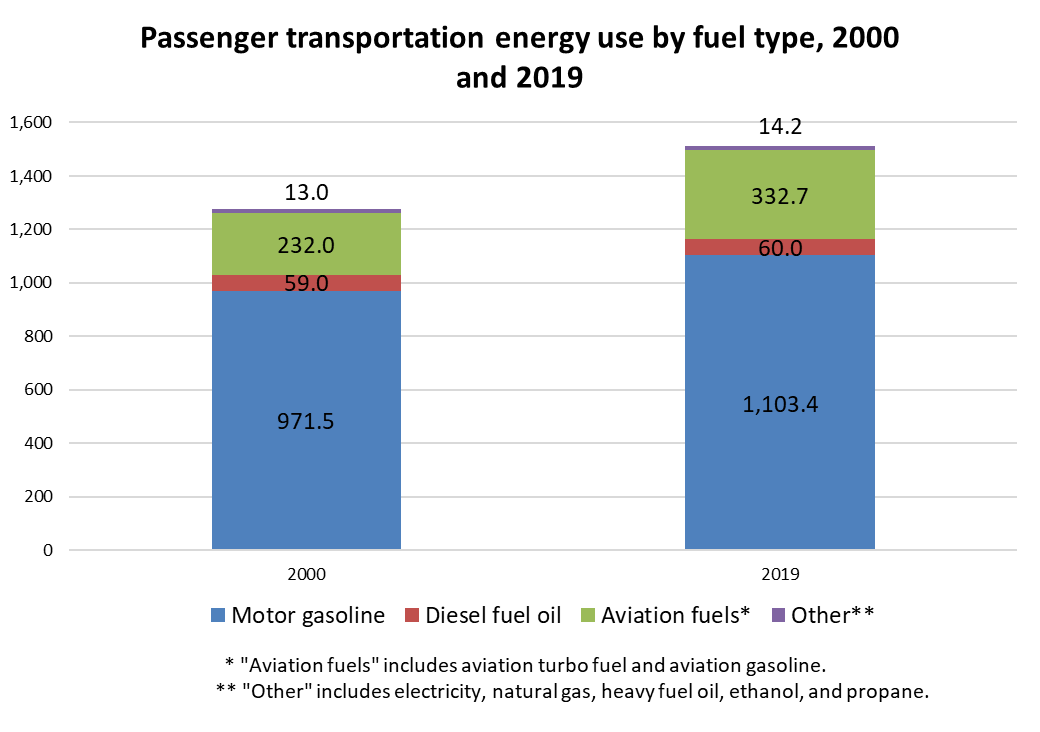
Passenger transportation energy use by fuel type, 2000 and 2019 (petajoules)
| 2000 | 2019 | |
|---|---|---|
| Motor gasoline | 971.5 | 1,103.4 |
| Diesel fuel oil | 59.0 | 60.0 |
| Aviation fuelsFootnote * | 232.0 | 332.7 |
| OtherFootnote ** | 13.0 | 14.2 |
Text version
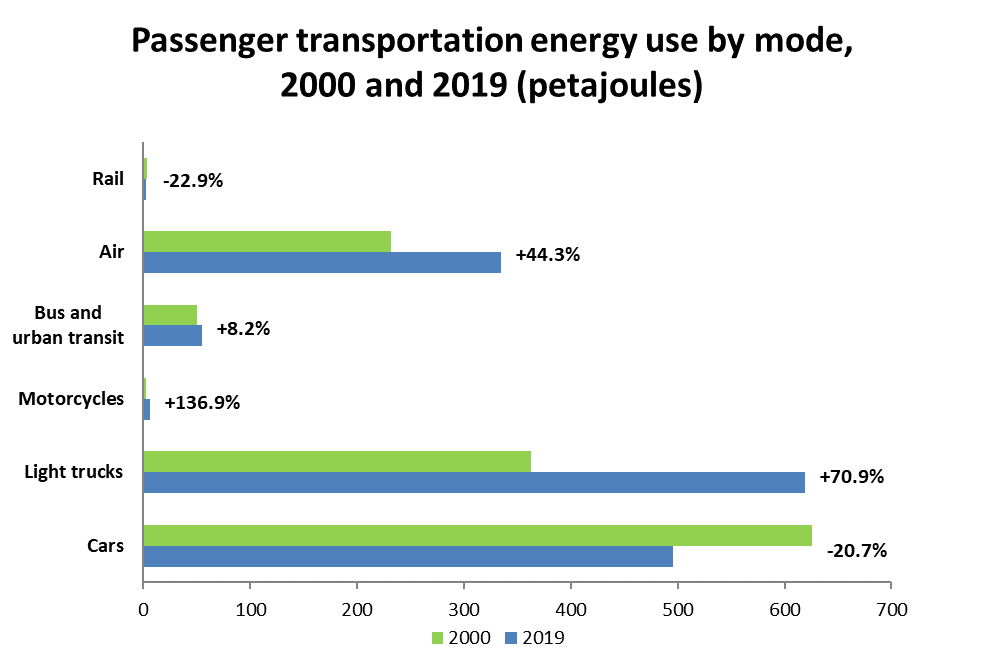
Passenger transportation energy use by mode, 2000 and 2019 (petajoules)
| 2000 | 2019 | Growth/decrease | |
|---|---|---|---|
| Rail | 3.0 | 2.3 | -22.9% |
| Air | 232.0 | 334.7 | 44.3% |
| Bus and urban transit | 50.3 | 54.4 | 8.2% |
| Motorcycles | 2.5 | 5.8 | 136.9% |
| Light trucks | 362.3 | 619.2 | 70.9% |
| Cars | 625.5 | 495.8 | -20.7% |
A growing number of Canadians bought light trucks (including minivans and sport utility vehicles [SUVs]) instead of vehicles with a better fuel consumption rating. Light truck sales accounted for 59% of all new passenger vehicles sold in 2019, compared to 36% in 2000. This shift from cars to light trucks has resulted in a significant increase in passenger-transportation energy consumption. Light truck energy consumption increased at a faster pace (i.e. 71%) between 2000 and 2019 than any other mode of passenger transportation (except for motorcycles, which represent a small share of consumption).
Air transport is also more popular. Since 2000, Canadians are increasingly using air transportFootnote 4, resulting in a significant increase of Pkm (122%). However, energy consumption only increased by 44%, which shows a growing improvement in efficiency.
 Freight transportation energy use
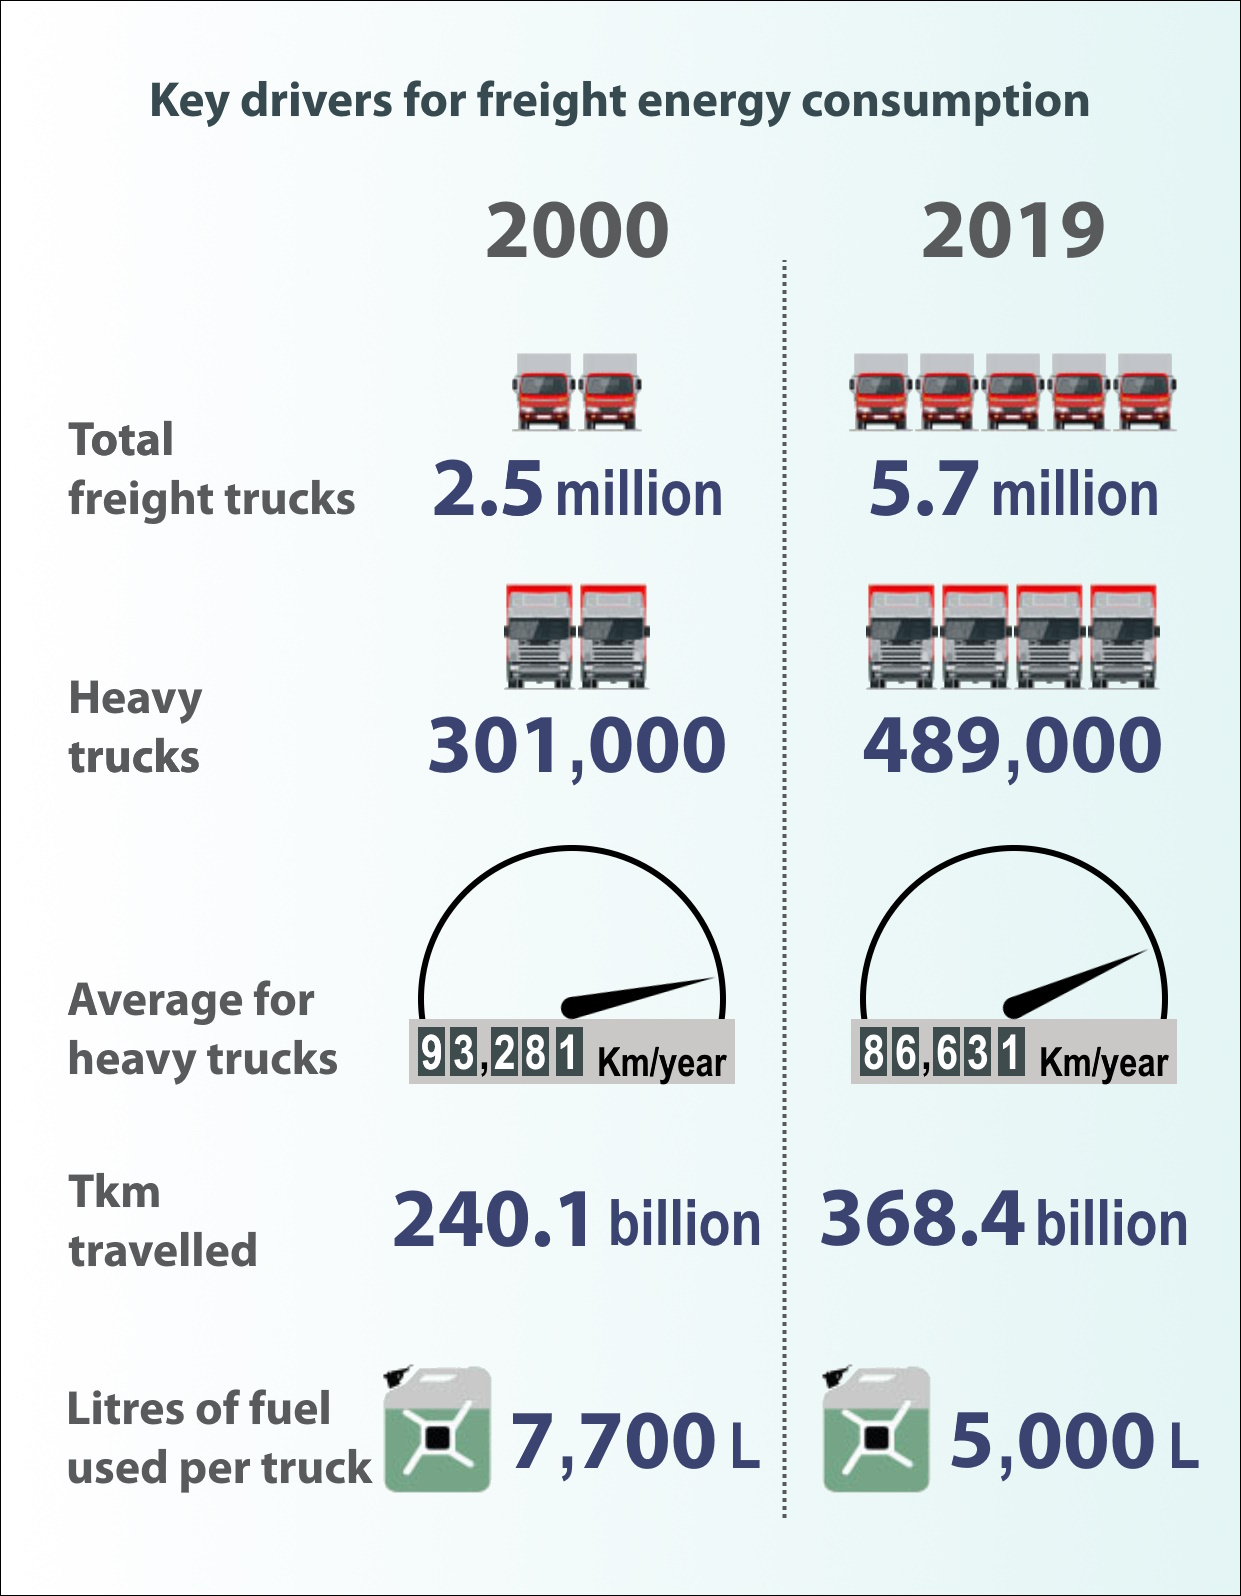
Text version
Key drivers for freight energy use
| 2000 | 2019 | |
|---|---|---|
| Total freight trucks (million) | 2.5 | 5.7 |
| Heavy trucks | 301,000 | 489,000 |
| Average for heavy trucks (km/year) | 93,281 | 86,631 |
| Tkm travelled (billion) | 240.1 | 368.4 |
| Litres of fuel used per truck | 7,700 | 5,000 |
In Canada, the freight transportation subsector includes four modes of transportation: road, air, marine and rail. Transportation by truck is divided into three types: light truck, medium truck and heavy truck. Energy consumption for freight transportation is linked to tonne-kilometres (Tkm)Footnote 5.
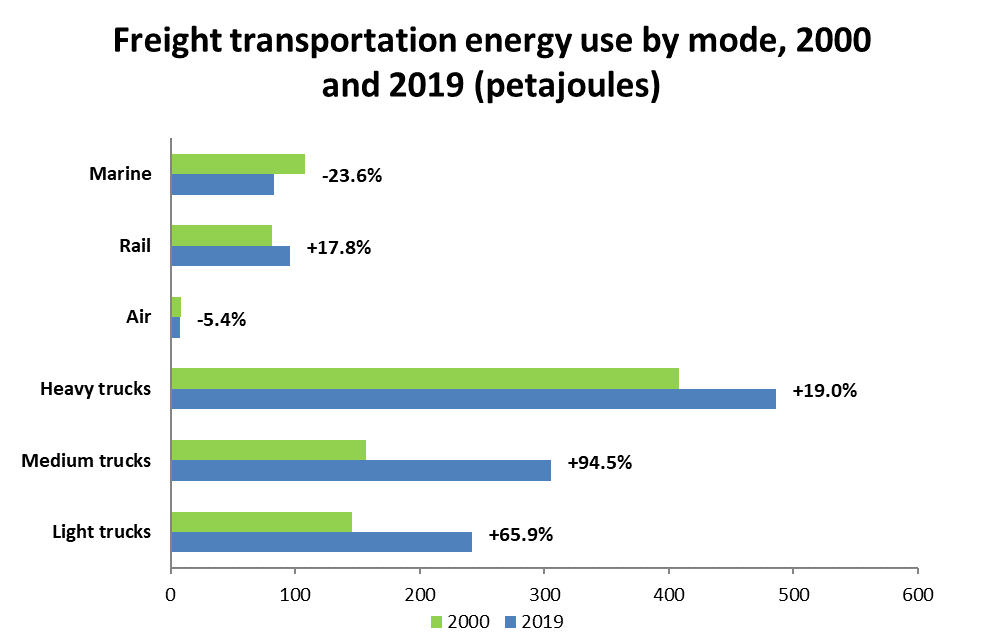
Text version
Freight transportation energy use by mode, 2000 and 2019 (petajoules)
| 2000 | 2019 | Growth/decrease | |
|---|---|---|---|
| Marine | 108.2 | 82.7 | -23.6% |
| Rail | 81.5 | 96.0 | 17.8% |
| Air | 8.1 | 7.7 | -5.4% |
| Heavy trucks | 408.2 | 485.8 | 19.0% |
| Medium trucks | 157.1 | 305.5 | 94.5% |
| Light trucks | 145.8 | 242.0 | 66.0% |
Freight transportation energy use increased 34.2% from 2000 to 2019. Consequently, there was a 33% increase in associated GHG emissions, from 64.8 Mt in 2000 to 86.0 Mt in 2019.
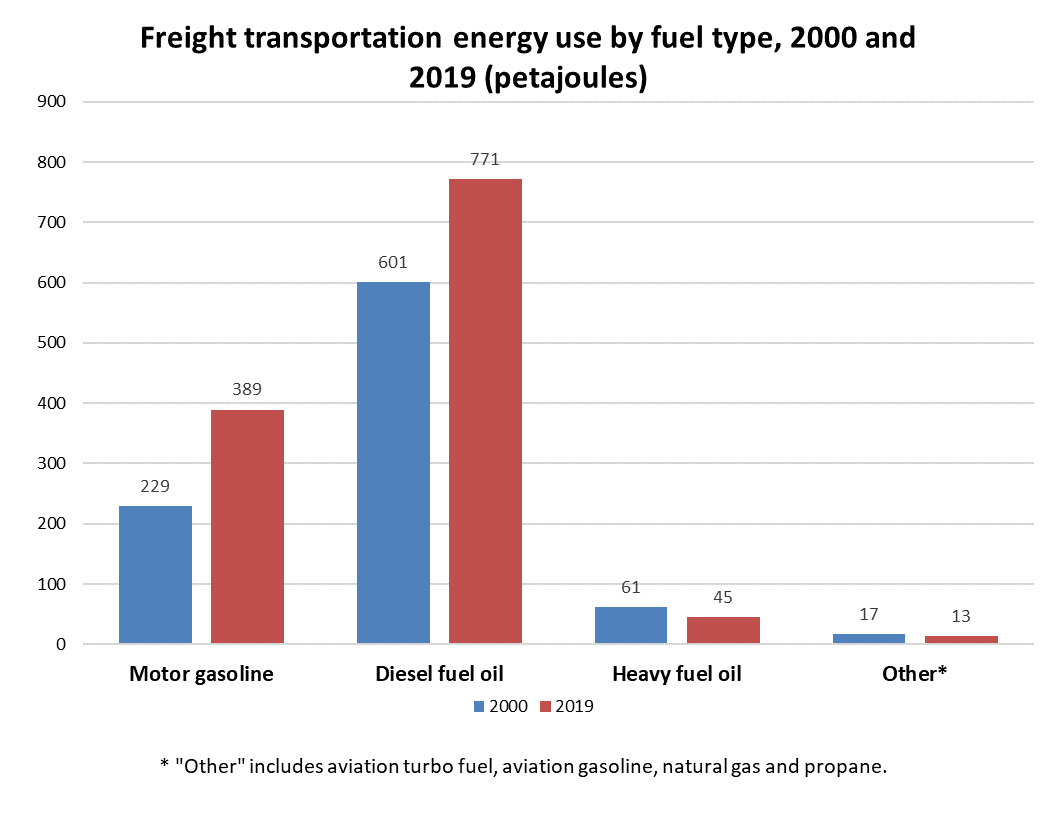
Text version
Freight transportation energy use by fuel type, 2000 and 2019 (petajoules)
| 2000 | 2019 | |
|---|---|---|
| Motor gasoline | 229 | 389 |
| Diesel fuel oil | 601 | 771 |
| Heavy fuel oil | 61 | 45 |
| OtherFootnote * | 17 | 13 |
The mix of fuels used in the freight transportation subsector remained relatively constant between 2000 and 2019. Diesel was the main energy source, representing 63% of all the fuels consumed for freight transportation.
Just-in-time delivery stimulated the demand for heavy truck transportationFootnote 6.
Using transport vehicles as virtual warehouses requires a transportation system that is “in time” and very efficient. The number of heavy trucks increased by 62.2% from 2000 to 2019. This new trend has contributed to the increase in the number of Tkm and energy use in the freight transportation subsector. Heavy trucks transported 280 billion Tkm in 2019, an increase of 38.3% compared to 2000.
For many goods, such as coal and cereal, trucks are not an efficient mode of transportation. Rail and marine transport continue to be the modes of choice. They therefore have an important place in the freight transportation sector. Rail transport holds the first position in terms of Tkm of freight transported with 451.2 billion Tkm in 2019, 40% more than in 2000.
 Passenger transportation energy intensity
Energy intensity decreased 16% between 2000 and 2019, from 2.0 MJ/Pkm to 1.7 MJ/Pkm, which was driven by improved vehicle fuel performance. Average fuel performance is measured in litres consumed per 100 km (L/100 km).
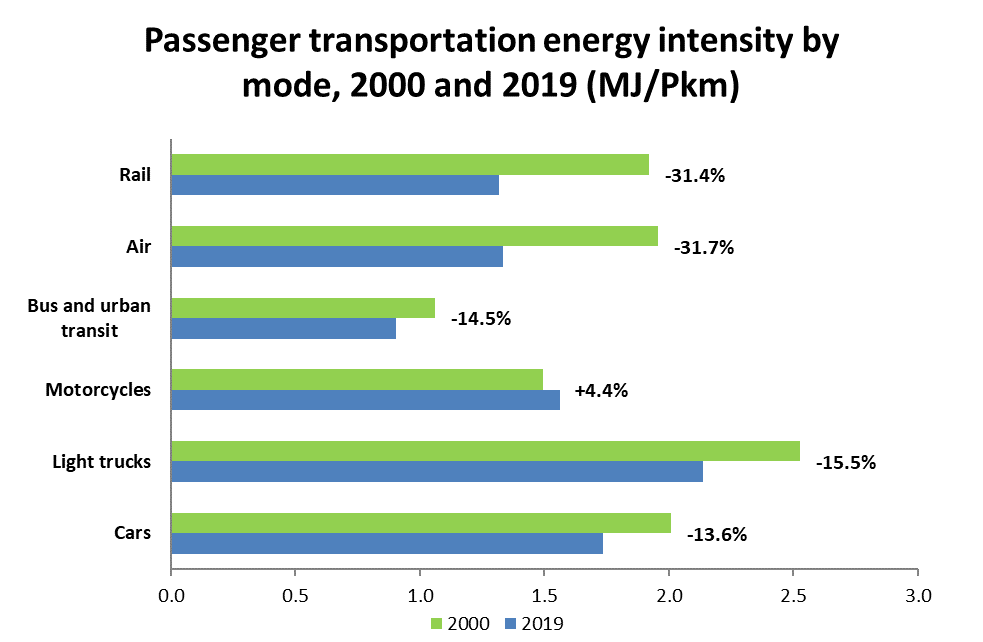
Text version
Passenger transportation energy intensity by mode, 2000 and 2019 (MJ/Pkm)
| 2000 | 2019 | Growth/decrease | |
|---|---|---|---|
| Rail | 1.9 | 1.3 | 31.4% |
| Air | 2.0 | 1.3 | 31.7% |
| Bus and urban transit | 1.1 | 0.9 | 14.5% |
| Motorcycles | 1.5 | 1.6 | -4.5% |
| Light trucks | 2.5 | 2.1 | 15.5% |
| Cars | 2.0 | 1.7 | 13.6% |
All modes of transportation, except motorcycles, achieved a reduction in energy intensity. Air transportation showed the greatest improvement, followed by passenger rail and light-duty vehicles.
 Freight transportation energy intensity
Text version
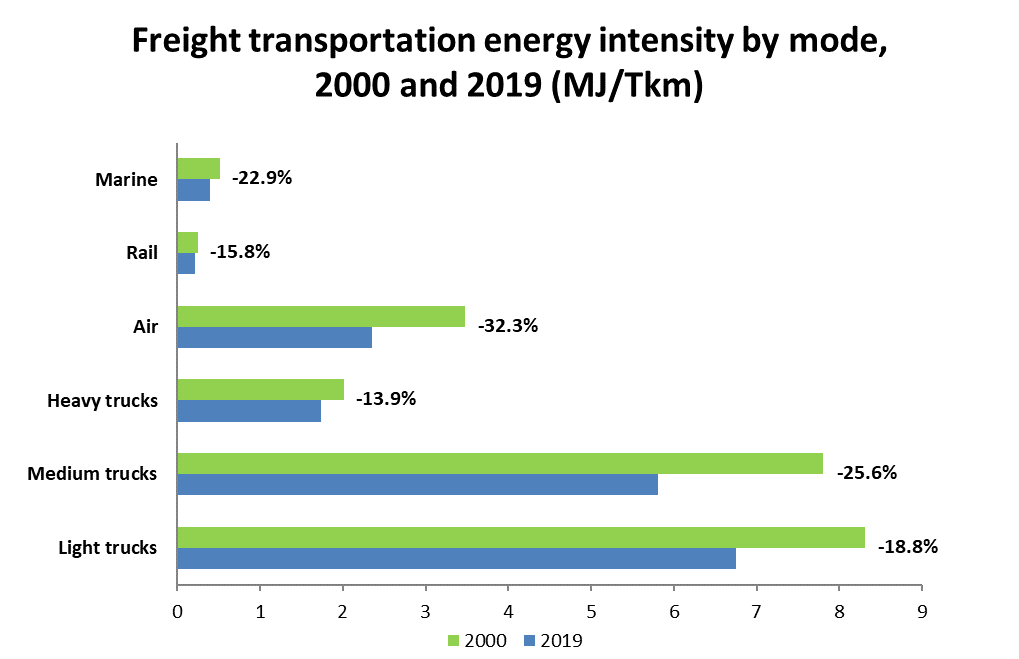
Freight transportation energy intensity by mode, 2000 and 2019 (MJ/Tkm)
| 2000 | 2019 | Growth/decrease | |
|---|---|---|---|
| Marine | 0.5 | 0.4 | -22.9% |
| Rail | 0.3 | 0.2 | -15.8% |
| Air | 3.5 | 2.4 | -32.3% |
| Heavy trucks | 2.0 | 1.7 | -13.9% |
| Medium trucks | 7.8 | 5.8 | -25.6% |
| Light trucks | 8.3 | 6.8 | -18.8% |
Since 2000, all the modes of freight transportation have become more efficient with respect to energy consumption, based on the number of Tkm. Accordingly, the sector’s energy intensity has slightly increased by 0.9% over the period, from 1.17 MJ/Tkm to 1.18 MJ/Tkm.
Passenger transportation energy efficiency
Measuring the effect of energy efficiency
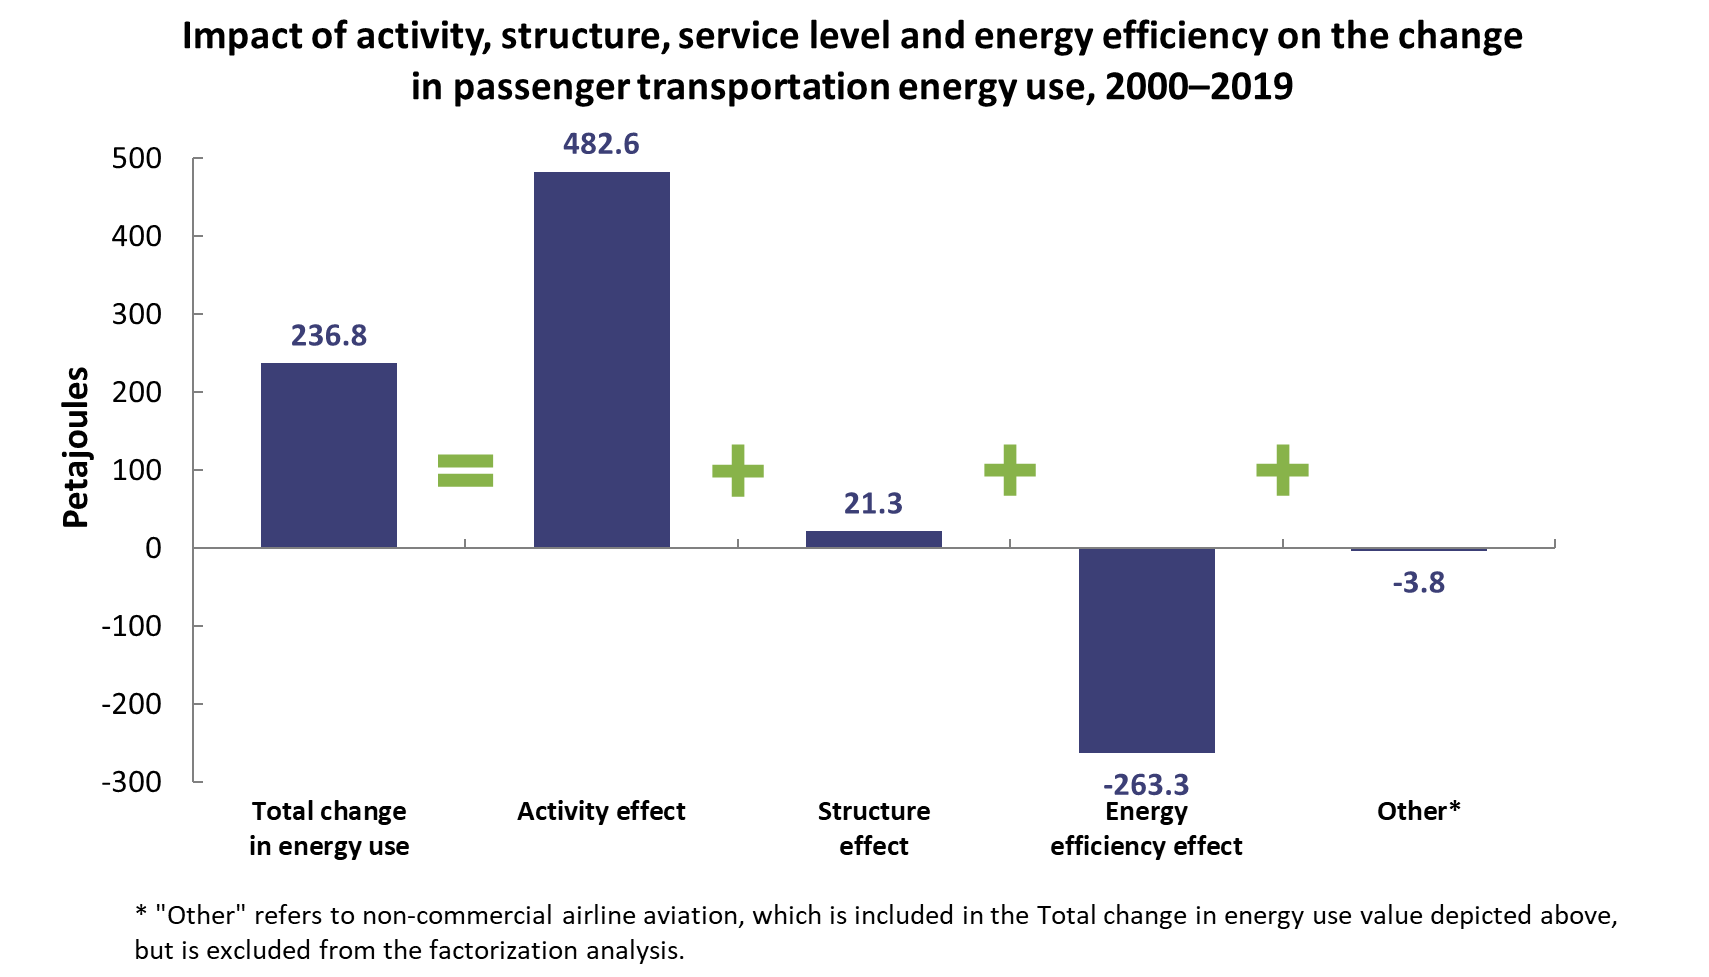
Without energy efficiency gains, energy use would have increased 40% instead of 19%.
Text version
Impact of activity, structure, service level and energy efficiency on the change in passenger transportation energy use, 2000–2019 (petajoules)
| Petajoules | |
|---|---|
| Total change in energy use | 236.8 |
| Activity effect | 482.6 |
| Structure effect | 21.3 |
| Energy efficiency effect | -263.3 |
| OtherFootnote * | -3.8 |
Passenger transportation energy use, with and without energy efficiency improvements, 2000–2019 (petajoules)
Text version
Passenger transportation energy use, with and without energy efficiency improvements, 2000–2019 (petajoules)
| Energy use with energy efficiency improvements | Energy use without energy efficiency improvements | |
|---|---|---|
| 2000 | 1,248 | 1,248 |
| 2001 | 1,221 | 1,251 |
| 2002 | 1,264 | 1,287 |
| 2003 | 1,272 | 1,293 |
| 2004 | 1,292 | 1,326 |
| 2005 | 1,311 | 1,359 |
| 2006 | 1,287 | 1,365 |
| 2007 | 1,324 | 1,419 |
| 2008 | 1,295 | 1,417 |
| 2009 | 1,293 | 1,429 |
| 2010 | 1,317 | 1,475 |
| 2011 | 1,315 | 1,494 |
| 2012 | 1,340 | 1,506 |
| 2013 | 1,369 | 1,533 |
| 2014 | 1,338 | 1,526 |
| 2015 | 1,366 | 1,572 |
| 2016 | 1,400 | 1,630 |
| 2017 | 1,423 | 1,675 |
| 2018 | 1,473 | 1,720 |
| 2019 | 1,489 | 1,752 |
Energy efficiency improvement can be measured by estimating the difference between the change in passenger transportation energy use and the impacts of activity and structure effects:
- Activity effect – The activity effect (i.e. the number of Pkm travelled) resulted in an increase of 39% in energy, or 482.56 PJ, and 32.6 Mt in GHG emissions. This increase in the number of Pkm (activity effect) is driven mainly by a 102% increase in light truck activity and a 122% increase in air transportation activity.
- Structure effect – Changes to the mix of transportation modes (or the relative share of Pkm attributed to air, rail, and road transportation) are used to measure structural changes. Thus, an overall change in structure would result in a decrease (or increase) in energy consumption if the relative share of a more (or less) effective mode increases in importance relative to others. The relative share of Pkm travelled increased greatly for passenger air transportation and light trucks. The overall structure effect was positive, given the growing popularity of minivans and SUVs, which are more energy-intensive than other transportation modes. As a result, the structure effect resulted in an increase of 21.3 PJ in energy and 1.4 Mt in GHG emissions.
- Service level effect – There is no service level effect.
- Weather effect – There is no weather effect.
- Energy efficiency effect – The 21% improvement in energy efficiency saved 263.3 PJ in energy and 17.8 Mt in GHG emissions. The light vehicle segment (cars, light trucks and motorcycles) for passenger transportation accounted for 62% of those savings.
The 21% energy efficiency improvement in the transportation sector resulted in savings of $7.0 billion in energy costs for Canadians in 2019.
Freight transportation energy efficiency
Measuring the effect of energy efficiency
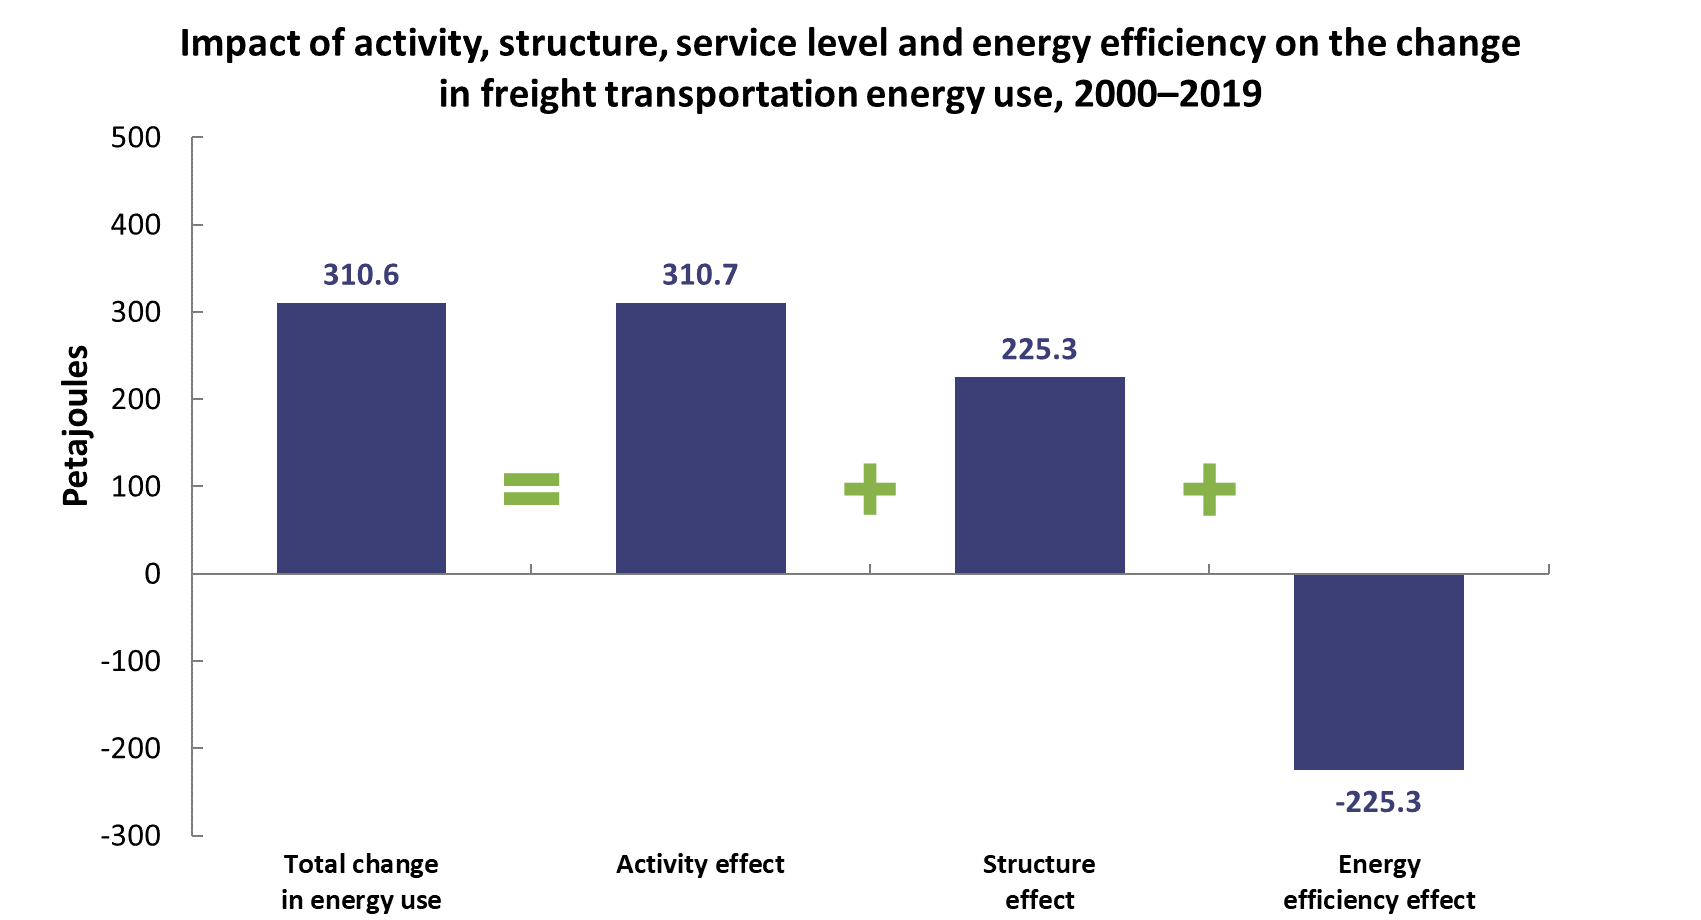
Without energy efficiency gains, energy use would have increased 59% instead of 34%.
Text version
Impact of activity, structure, service level and energy efficiency on the change in freight transportation energy use, 2000–2019 (petajoules)
| Petajoules | |
|---|---|
| Total change in energy use | 310.6 |
| Activity effect | 310.7 |
| Structure effect | 225.3 |
| Energy efficiency effect | -225.3 |
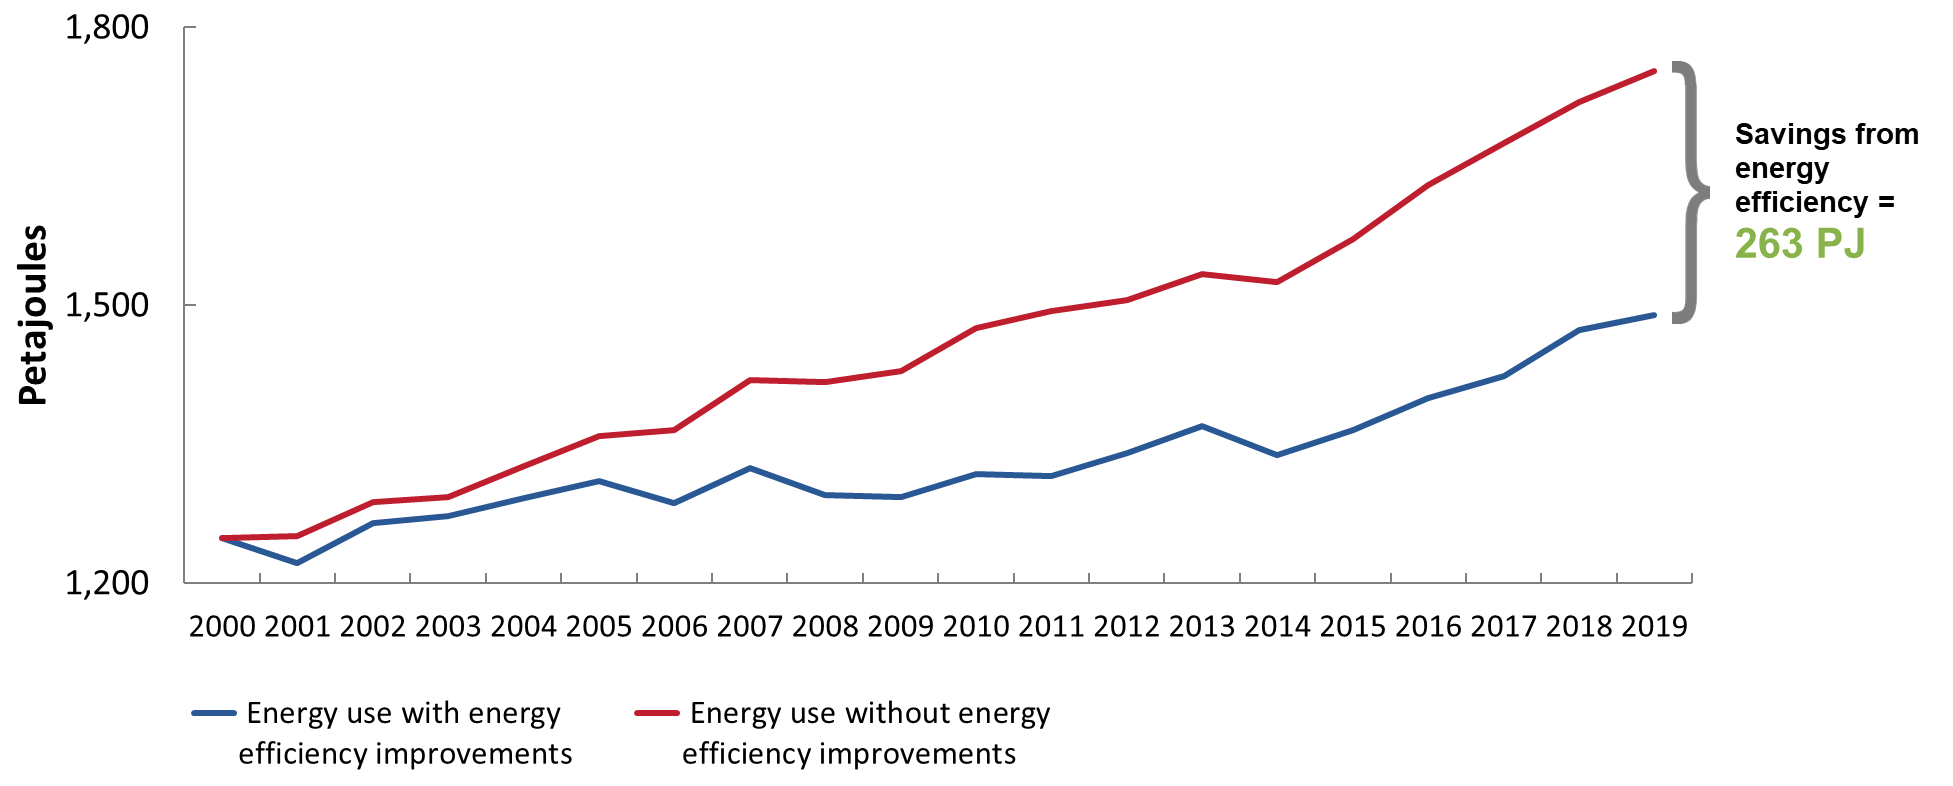
Freight transportation energy use, with and without energy efficiency improvements, 2000–2019 (petajoules)
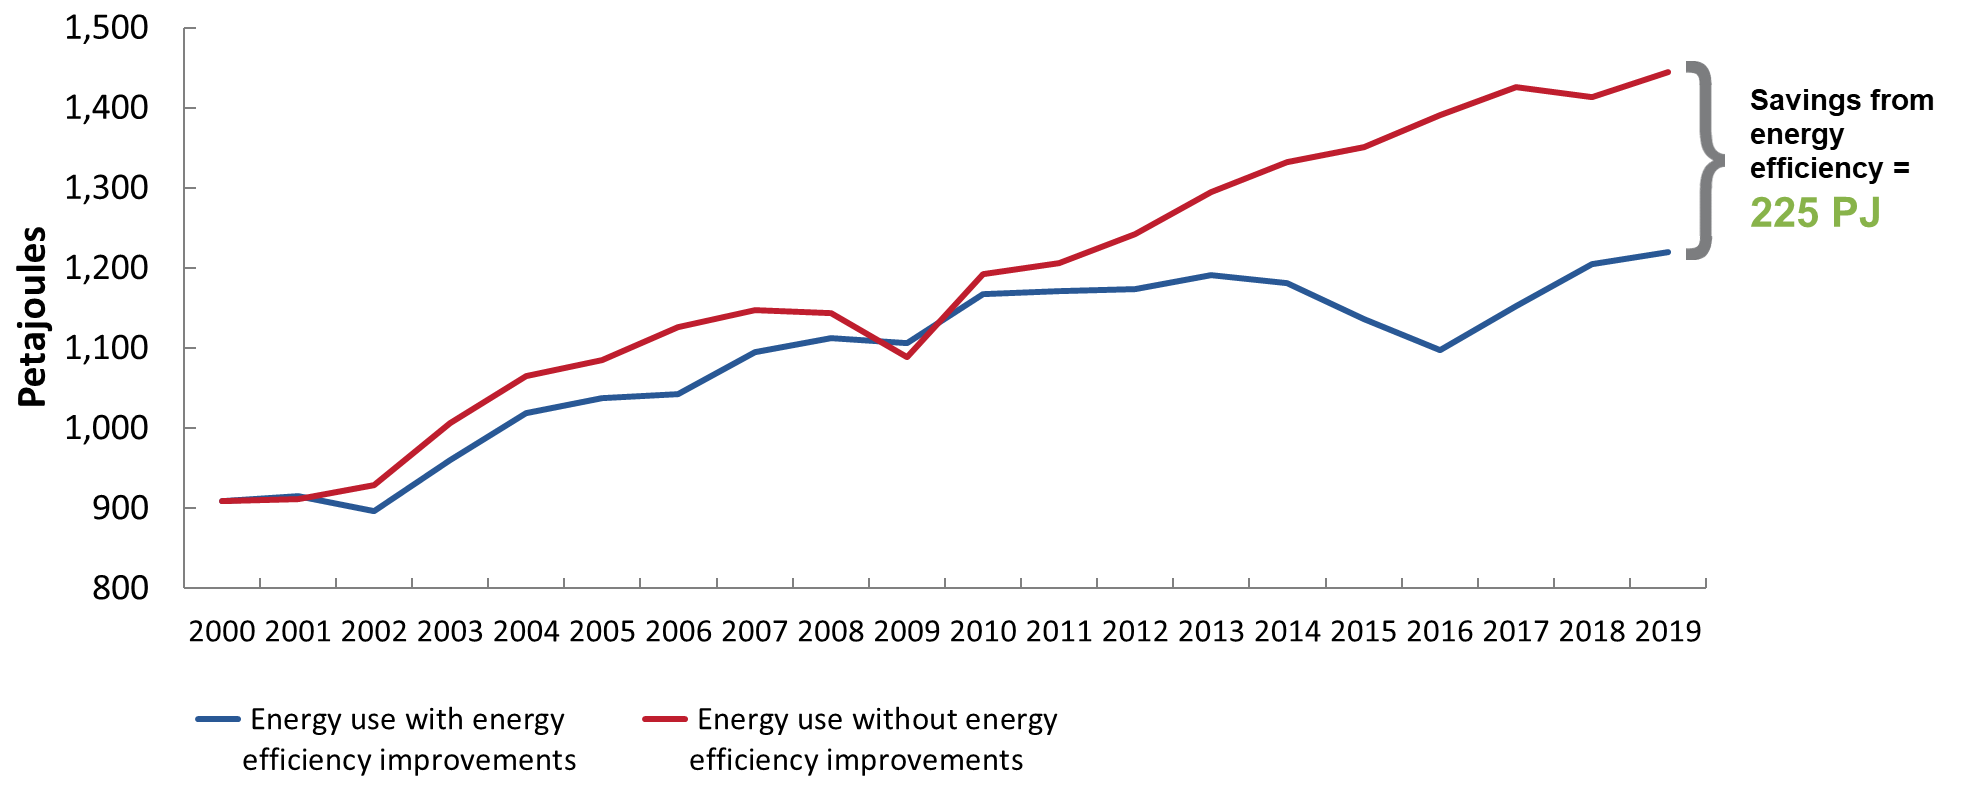
Text version
Freight transportation energy use, with and without energy efficiency improvements, 2000–2019 (petajoules)
| Energy use with energy efficiency improvements | Energy use without energy efficiency improvements | |
|---|---|---|
| 2000 | 909 | 909 |
| 2001 | 914 | 912 |
| 2002 | 897 | 929 |
| 2003 | 959 | 1,006 |
| 2004 | 1,018 | 1,065 |
| 2005 | 1,037 | 1,085 |
| 2006 | 1,042 | 1,126 |
| 2007 | 1,095 | 1,147 |
| 2008 | 1,112 | 1,144 |
| 2009 | 1,107 | 1,088 |
| 2010 | 1,167 | 1,192 |
| 2011 | 1,171 | 1,206 |
| 2012 | 1,173 | 1,242 |
| 2013 | 1,191 | 1,294 |
| 2014 | 1,180 | 1,333 |
| 2015 | 1,137 | 1,351 |
| 2016 | 1,098 | 1,391 |
| 2017 | 1,153 | 1,425 |
| 2018 | 1,205 | 1,413 |
| 2019 | 1,220 | 1,445 |
Energy efficiency improvement can be measured by estimating the difference between the change in freight transportation energy use and the impacts of activity and structure effects:
- Activity effect – The activity effect (i.e. the number of Tkm covered) resulted in an increase of 34% in energy, or 310.7 PJ, and 21.9 Mt in GHG emissions. This increase in the number of Tkm transported is driven by a 59% increase in rail freight transport.
- Structure effect – Changes to the mix of transportation modes (or the relative share of Tkm attributed to air, rail, and road transportation) are used to measure changes in structure. Thus, an overall change in structure would result in a decrease (or increase) in energy consumption if the relative share of a more (or less) effective mode increases in importance relative to others. The change in modes is due to the increase in the relative share of goods transported by trucks compared to other modes. The overall structure effect was positive given the growth of Canada-US trade and the "just-in-time" delivery required by customers, thereby contributing to an increase in the use of road transportation modes, which are more energy-intensive than the others per Tkm. The structure effect resulted in an increase of 225.3 PJ in energy and 15.9 Mt in GHG emissions.
- Service level effect – There is no service level effect.
- Weather effect – There is no weather effect.
- Energy efficiency effect – The 25% improvement in energy efficiency saved 225.3 PJ in energy and 15.9 Mt in GHG emissions. The road vehicle segment (light trucks, medium trucks, and heavy trucks) for freight transportation accounted for 83% of those savings.
In 2019, energy efficiency improvement in the freight transportation sector saved $7.2 billion in costs. The economic crisis that began with the bursting of the US housing bubble in 2008 particularly affected the efficiency of freight transportation until 2010. Medium and heavy trucks continued to travel carrying much less goods, thus increasing fuel consumption per Tkm.